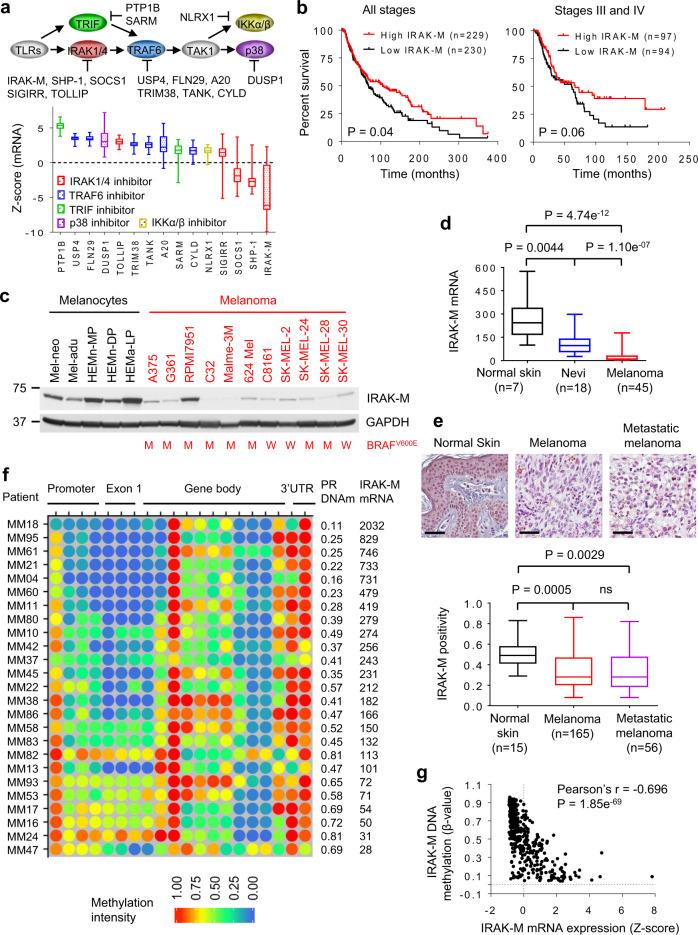
Fig. 1. IRAK-M expression is absent or low in human melanoma.
a mRNA expression profiles of negative regulators of TLR signaling in 56 human melanoma cell lines using the CCLE dataset. b Kaplan–Meier survival analyses of all and stage III/IV melanoma patients from the TCGA database. Melanoma patients were stratified into ‘high’ (above the median) and ‘low’ (below the median) IRAK-M expression. The number (n) in parentheses is the number of patients. P-values were determined with the Log-rank (Mantel-Cox) test. c IRAK-M protein levels were determined by western blot in human melanocytes and melanoma cell lines. The BRAF V600E mutation status is indicated as M mutation and W wild-type. Blots are representative of at least three independent experiments. d IRAK-M mRNA levels in normal human skin and biopsy specimens from melanoma patients with the number of samples (n) shown in parentheses. The analysis of IRAK-M expression was performed based on the online published microarray database (GEO GSE3189). P-values by two-tailed Student’s t-test. e Protein expression of IRAM-M in human normal skin and tumor tissues was detected using Immunohistochemistry (IHC) on melanoma tissue microarrays. Representative IHC images are shown (scale bars, 100 µm). Positivity was defined as the total number of positive pixels over the total number of pixels. The number of analyzed samples (n) is indicated in each column. P-values by two-tailed Student’s t-test. f DNA methylation (β-value) and mRNA levels (signal intensity) of IRAK-M in 25 melanoma patient samples obtained from the GEO database (GSE51547 and GSE22153). Promoter DNA methylation (PR DNAm) values and mRNA levels are along patient samples. g DNA methylation β-values and gene expression Z-scores (RNA-seq V2RSEM) of IRAK-M in TCGA skin cutaneous melanoma database consisting of 471 patient samples obtained from the cBioPortal (www.cbioportal.org). Each symbol represents one patient sample. The dotted lines indicate β-values and Z-scores of 0. Correlation was evaluated using Pearson’s correlation test. Pearson’s r and p-values for the correlation are indicated.

