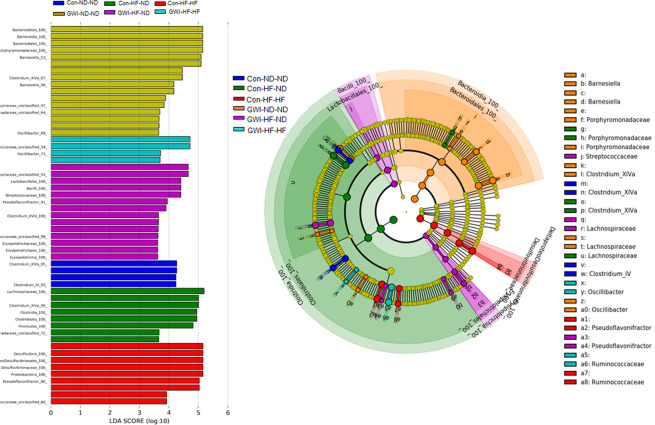
Figure 6.
Bacterial taxa that were differentially abundant across treatments. LEfSe was carried out using the Galaxy Project and the results are displayed in the bar charts (A) and the associated cladogram (B). Taxa showing different abundance values in each treatment group (according to LEfSe) are shown in the cladogram highlighted by small circles and by shading. All groups are statistically significant compared to each other (LDA > 3.6). Con = control; GWI = PER + PB; ND = normal diet; HF = high fat diet.

