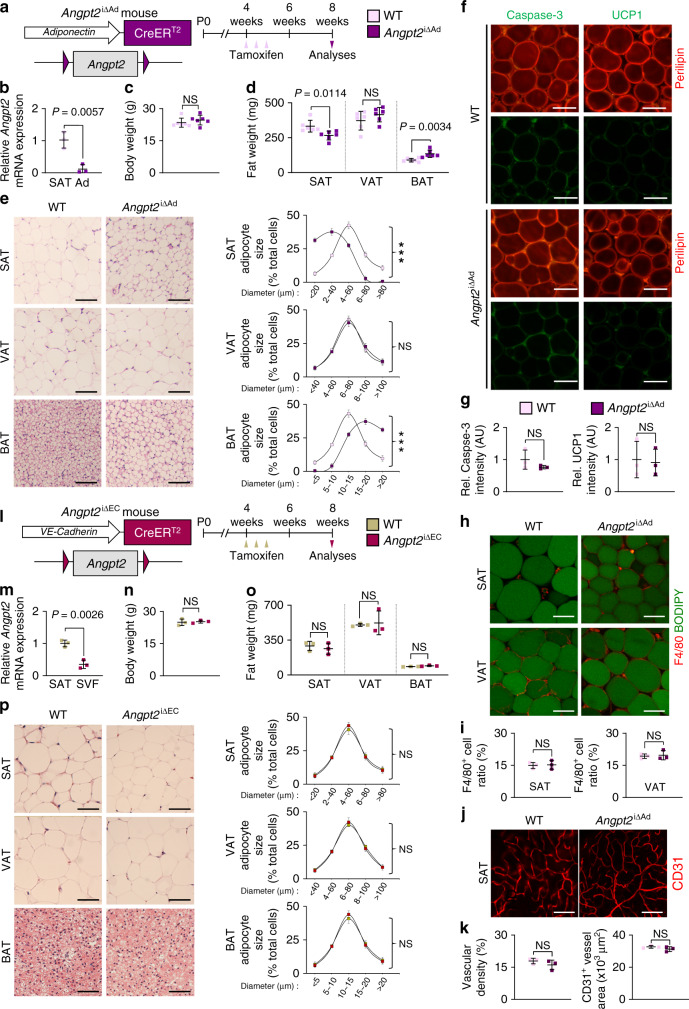
Fig. 1. Depletion of Angpt2 from adipocytes alters subcutaneous fat distribution.
a Diagram for generation of Angpt2i∆Ad mice, inducible and specific deletion of Angpt2 in adipocytes by tamoxifen delivery into 4 week old mice and analyses in 8-week old mice. b Comparisons of Angpt2 mRNA expression in fractionized adipocytes (Ad) of SAT in WT and Angpt2i∆Ad mice. c, d Comparison of body weight and fat weight in different adipose tissues between WT and Angpt2i∆Ad mice. n = 6 mice/group pooled from three independent experiments. e Representative H&E-stained images and comparisons in adipocyte size (diameter; μm) of different adipose tissues in WT and Angpt2∆Ad mice. Four to six different mice of each genotype were randomly selected to determine the adipocyte size and data are presented as % of total cells. Scale bars, 50 μm. f, g Representative images and comparisons of apoptosis (Caspase-3) and beiging (UCP1) in SAT of WT and Angpt2i∆Ad mice. Scale bars, 50 μm. h, i Representative images and comparison of indicated immune cell infiltration in SAT and VAT of WT and Angpt2i∆Ad mice. Magnified view is shown in right panels. Scale bars, 30 μm. j, k Representative images and comparisons of vascular density and CD31+ vessel area in SAT of WT and Angpt2i∆Ad mice. Scale bars, 100 μm. l Diagram for generation of Angpt2i∆EC mice, inducible and specific deletion of Angpt2 in endothelial cells by tamoxifen delivery into 4 week old mice and analyses in 8 week old mice. m Comparisons of Angpt2 mRNA expression in stromal vascular fraction (SVF) of SAT in WT and Angpt2i∆EC mice. n, o Comparison of body weight and fat weight in different adipose tissues between WT and Angpt2i∆EC mice. p Representative H&E-stained images and comparisons in adipocyte size (diameter; μm) of different adipose tissues in WT and Angpt2i∆EC mice. Four different mice of each genotype were randomly selected to determine the adipocyte size and data are presented as % of total cells. Scale bars, 50 μm. Unless otherwise denoted, each dot indicates a value obtained from one mouse and n = 3 mice/group pooled from two independent experiments. Horizontal bars indicate mean ± SD and P values versus WT by two-tailed Student’s t test. NS not significant.

