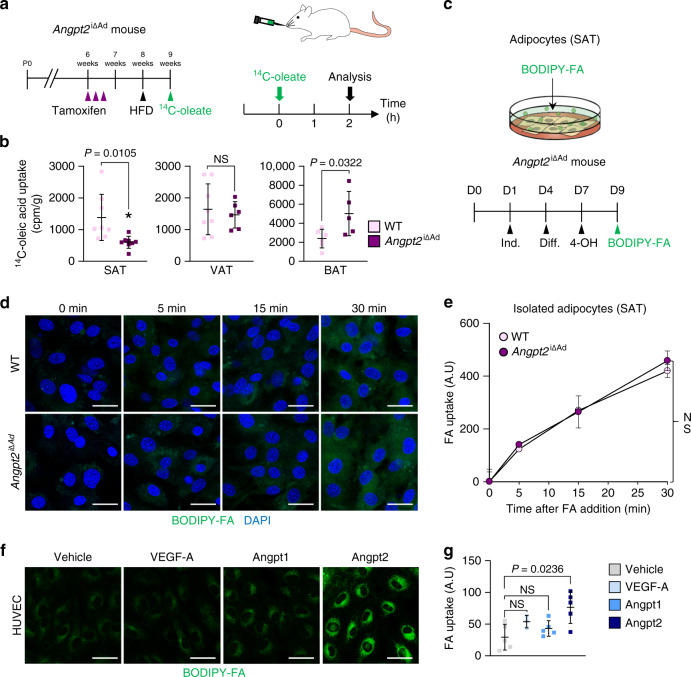
Fig. 2. Angpt2 stimulates endothelial FA uptake.
a Diagram depicting the experiment scheme for examining fatty acid (14C-oleate) transport into different adipose tissues in Angpt2i∆Ad mice delivered with tamoxifen into 6 week old mice and HFD from 8 week old mice and their analyses in 9 week old mice. Adipose tissues were harvested 2 h after oral gavage of 2 mCi of 14C-oleate dissolved in 200 µl olive oil. b Comparisons of 14C-oleic acid uptake in different adipose tissues in WT and Angpt2i∆Ad mice. Each dot indicates a value obtained from one mouse using n = 8(SAT), 8(VAT WT), 6(VAT Angpt2i∆Ad), 6(BAT WT), and 5(BAT Angpt2i∆Ad) mice/group pooled from two independent experiments. Horizontal bars indicate mean ± SD and P values versus WT by two-tailed Student’s t test. NS not significant. c Diagram depicting FA uptake of primary cultured adipocytes between WT and Angpt2i∆Ad mice. SVF of SAT from WT and Angpt2i∆Ad mice were isolated and cultured until confluence with adipocyte induction and differentiation medium at indicated days. After 2 days of 4-OH treatment to delete Angpt2, cells were analyzed for FA uptake. d, e Representative images and comparisons of FA (BODIPY C-12, 0.75 µM) uptake at indicated time points in primary cultured adipocytes from SAT of WT and Angpt2i∆Ad mice. Each dot indicates a value obtained from one mouse using n = 3 mice/group pooled from two independent experiments. Horizontal bars indicate mean ± SEM. NS not significant. Scale bars, 30 μm. f, g Representative images and comparisons of FA (BODIPY C-12, 8 µM) uptake in HUVECs after treatment with VEGF-A (40 ng/ml), Angpt1 (200 ng/ml), or Angpt2 (2.5 μg/ml) for 30 min. n = 3 (VEGF-A), 5(Vehicle, Angpt1, Angpt2) for each group. Horizontal bars indicate mean ± SD and P values versus vehicle by one-way ANOVA followed by Tukey’s multiple comparison test. Scale bars, 30 μm.

