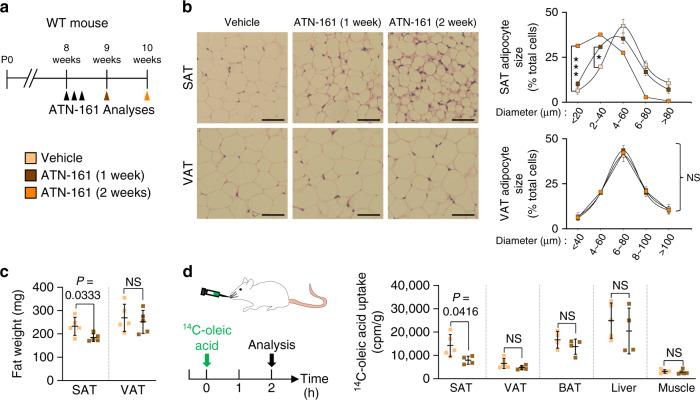
Fig. 7. Integrin α5β1 drives subcutaneous fat distribution.
a Diagram depicting experimental scheme for integrin α5β1 antagonist treatment. 8-week-old WT mice were treated with integrin α5β1 blocking peptide (ATN-161, 30 mg/kg) and analyzed 1 or 2 weeks later. Black arrowheads indicate injections of ATN-161. b Representative H&E-stained images and comparisons in adipocyte size (diameter; μm) in SAT and VAT of ATN-161 treated mice. Four different mice of each genotype were randomly selected to determine the adipocyte size and data are presented as % of total cells. Horizontal bars indicate mean ± SD and *P < 0.05; ***P < 0.001 versus WT by two-tailed Student’s t test. Scale bars, 30 μm. c Comparison of fat weight (mg) of SAT and VAT in ATN-161 treated mice. n = 5 for each group. Horizontal bars indicate mean ± SD and P values versus WT by two-tailed Student’s t test. NS, not significant. d Diagram of experimental scheme and comparisons of 14C-oleic acid uptake in different adipose tissues and metabolic organs between vehicle and ATN-161 treated mice. 8-week-old WT mice were dosed with ATN-161, and administered with 14C-oleic acid 1 week after. n = 4 (WT BAT; ATN-161 SAT, VAT, BAT, and liver), 5 (WT SAT, VAT, liver, and muscle; ATN-161 muscle). Horizontal bars indicate mean ± SD and P values versus vehicle by two-tailed Student’s t test. NS not significant.

