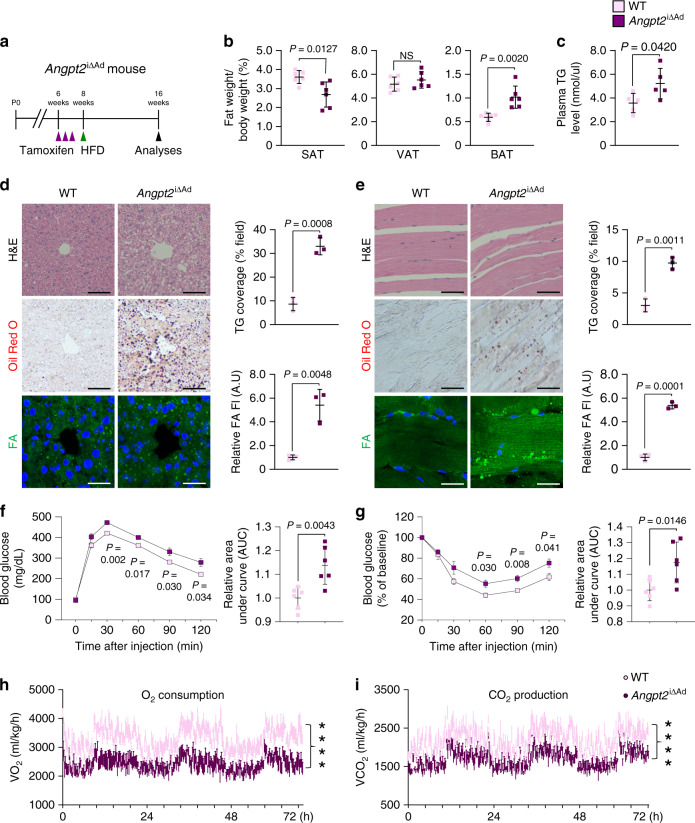
Fig. 9. Adipocyte-derived Angpt2 prevents ectopic lipid-induced insulin resistance.
a Generation of Angpt2i∆Ad mouse, inducible and specific deletion of Angpt2 in adipocytes in 6-week-old mice, and analysis after 8 weeks of HFD. Purple arrowheads indicate daily injections of tamoxifen. b Comparisons of fat-to-body weight ratio in different adipose tissues between WT and Angpt2i∆Ad mice fed with HFD. Each dot indicates a value obtained from one mouse and n = 6 mice/group pooled from two independent experiments. c Comparison of plasma triglyceride (TG) levels between WT and Angpt2i∆Ad mice. Each dot indicates a value obtained from one mouse and n = 5 mice/group pooled from two independent experiments. d Representative images and comparisons of H&E-stained sections, Oil Red O staining and coverage (% of field), and BODIPY-FA staining and uptake (fluorescent unit, FI) of liver between WT and Angpt2i∆Ad mice fed with HFD. Each dot indicates a mean of triplicate values from three independent experiments. Scale bars, 50 μm. e Representative images and comparisons of H&E-stained sections, Oil Red O staining and coverage (% of field), and BODIPY-FA staining and uptake (FI) of skeletal muscle between WT and Angpt2i∆Ad mice fed with HFD. Each dot indicates a mean of triplicate values from three independent experiments. Scale bars, 50 μm. f, g Comparisons of intraperitoneal glucose tolerance test (IPGTT) and intraperitoneal insulin tolerance test (IPITT) with corresponding area under curve (AUC) between WT and Angpt2i∆Ad mice fed with HFD. Each dot indicates a value obtained from one mouse and n = 6 mice/group pooled from three independent experiments. Horizontal bars indicate mean ± SEM. *P < 0.05; ***P < 0.001 versus WT by two-tailed Student’s t test. h, i Comparisons of O2 consumption and CO2 production. HFD fed WT and Angpt2∆Ad mice were subjected to metabolic cage assessment with CLAMS analysis. Each group, n = 6. Horizontal bars indicate mean ± SEM. ****P < 0.0001 versus WT by two-tailed Student’s t test. Unless otherwise denoted, horizontal bars indicate mean ± SD and P values versus WT by two-tailed Student’s t test (c, e, f, g). NS not significant.

