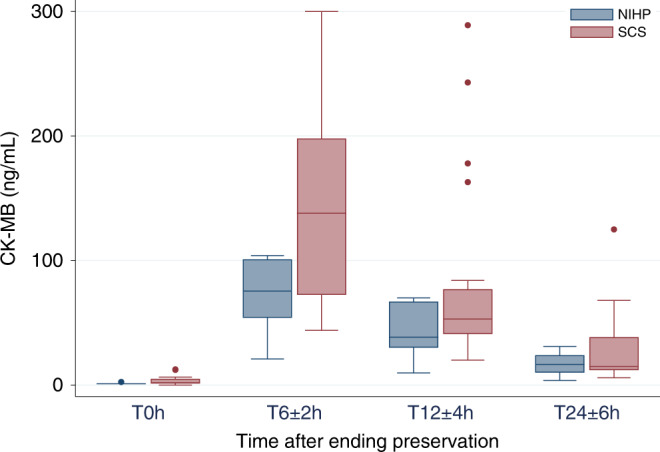
Fig. 4. Creatine kinase-muscle/brain level after preservation according to the treatment group.

The box plot shows the creatine kinase-muscle/brain (CK-MB) level at different timepoints after ending preservation (T0). Data are represented as boxplots. The middle line is the median, the lower and upper axis correspond to the first and third quartiles, the upper whisker extends from the axis to the largest value no further than 1.5 × interquartile range (IQR) from the axis, and the lower whisker extends from the axis to the smallest value (at most 1.5 × IQR) of the axis. Data beyond the end of the whiskers are outlying points that are plotted individually. NIHP (n = 6) nonischemic heart preservation; SCS (n = 25) static cold storage.
