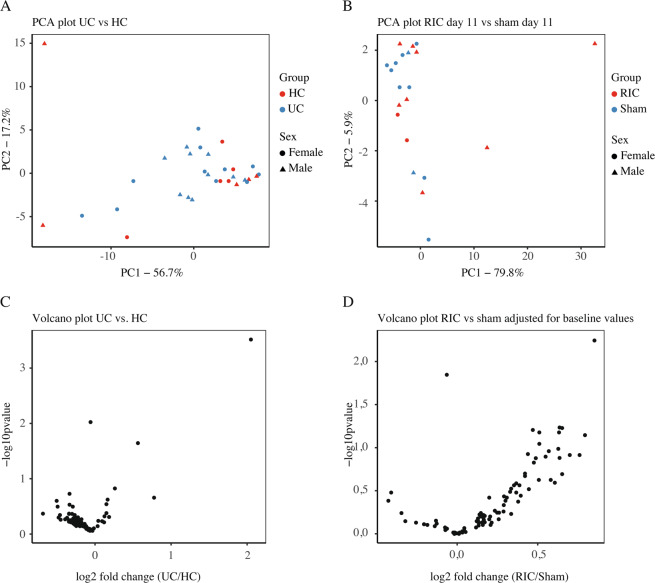
Figure 5.
(A) PCA plot calculated from miRNA read counts in plasma samples from UC patients (RIC and sham groups day 1 before intervention) and HC. (B) PCA plot calculated from miRNA read counts in plasma samples from the RIC group day 11 and the sham group day 11. (C) Volcano plot showing fold change (x-axis) and the statistical significance (y-axis) of each miRNA comparing the UC group (RIC and sham groups day 1 before intervention) and HCs. (D) Volcano plot showing fold change (x-axis) and the statistical significance (y-axis) of each miRNA comparing the RIC group at day 11 and the sham group at day 11 corrected for baseline values of read counts.

