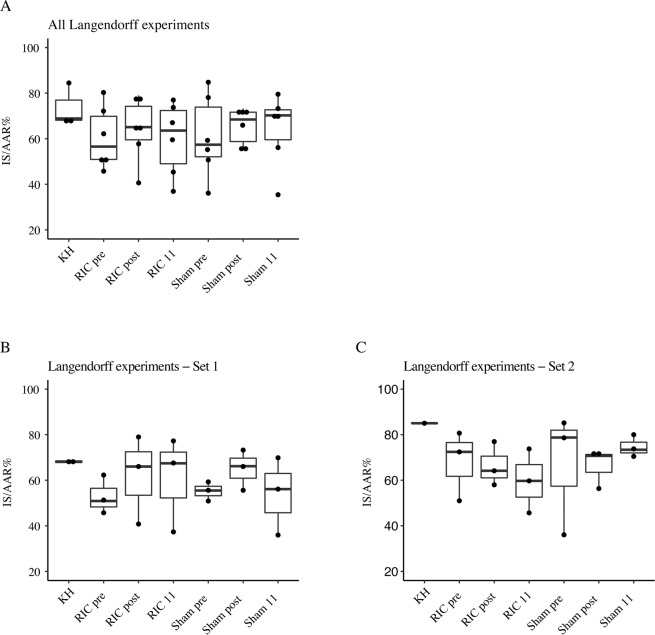
Figure 6.
Box-dot plot showing the IS/AAR (%) in the RIC and the sham groups at the different time points. (A) All Langendorff experiments (6 from the RIC group, 6 from the sham group, 3 KH), (B) Set 1 of Langendorff experiments (3 from the RIC group, 3 from the sham group, 2 KH). (C) Set 2 of Langendorff experiments (3 from the RIC group, 3 from the sham group, 1 KH). Pre, day 1 before the first intervention; post, 15 minutes post the first intervention; 11, after 10 days of daily interventions.

