Figure 2.

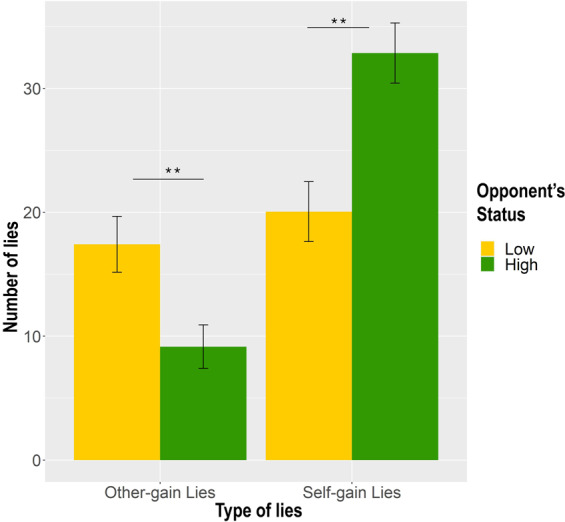
Factors influencing deceptive behavior. The figure shows the modulation of the deceptive behavior, i.e., number of lies (on the Y-axis) depending on the Outcome of the game and Opponent’s Status. On X-axis lies are divided in: other-gain when the outcome of the game is favorable for the participant, self-gain when it is unfavorable. Participants produced more other-gain lies when facing a low status opponent and more self-gain lies when facing a high-status opponent. **p < 0.01; *p < 0.05. The figure was made in R using ggplot2 package76.
