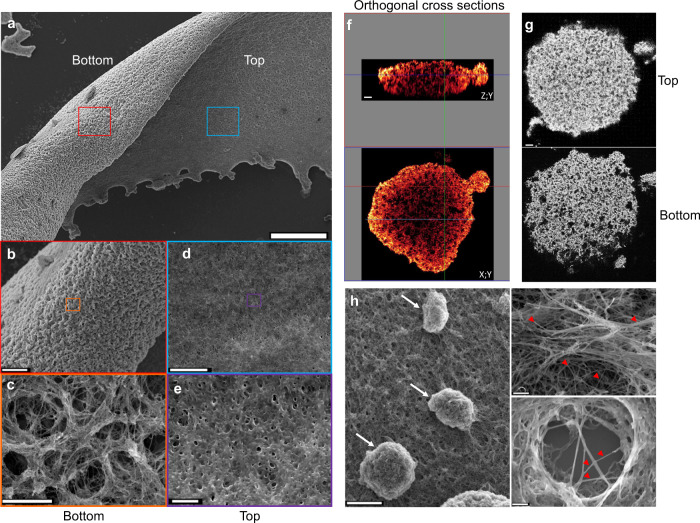
Fig. 2. Leptospira biofilm architecture and organization.
a SEM images of the apical and basal sides of Leptospira biofilm after 3 weeks of static culture Scale bar: 200 µm. b, c Higher magnification of the biofilm basal side showing large interconnected channels. Scale bars: 50 and 5 µm. d, e Higher magnification of the biofilm apical side showing a flat surface of bacteria enmeshed within an amorphous ECM Scale bars: 10 and 2 µm. f ZY (upper panel) and XY (lower panel) orthogonal cross-sections of CLSM images of bacteria stained with CFDA/SE Green CellTracker, showing the foam-like architecture of Leptospira biofilm. Scale bar: 10 µm. g CLSM images at the top (upper panel) and the bottom (lower panel) sides of a Leptospira biofilm illustrating the density gradient along the baso-apical polarity axis. Scale bar: 10 µm. h SEM images of a mature biofilm showing budding-like structures (left panel, arrows), and branching extracellular matrix filaments (right panels, red arrowheads). Scale bars: 20 µm (left); 2 µm (upper right); 1 µm (lower right).

