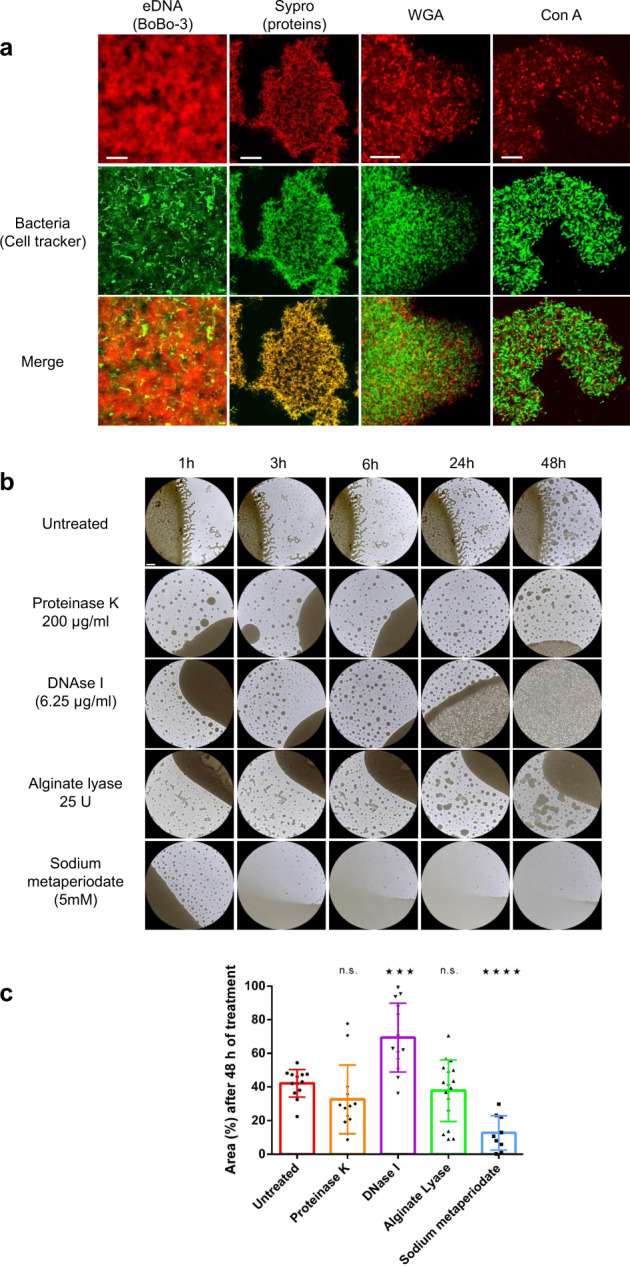
Fig. 3. Composition of the biofilm matrix.

a CLSM micrographs of biofilms stained with BOBO-3 (exDNA, Scale bar: 10 µm), Sypro Ruby (proteins, Scale bar: 20 µm), WGA (N-acetylglucosamine or sialic acid residues, Scale bar: 10 µm) and ConA (red/α-D-glucosyl or α-D-mannosyl residues, Scale bar: 10 µm), red, upper line. Bacteria were stained with a CFDA-SE cell-tracker (green, middle line). Merged images are shown in the lower line. b Phase contrast images of biofilms left untreated or treated for 1, 3, 6, 24 and 48 h with proteinase K (1 µg/mL), DNase I (6.25 µg/mL), alginate lyase (125 U/mL) and sodium metaperiodate (5 mM). Scale bar: 500 µm. c Surface based quantification of the area occupied by the biofilm after 48 h of exposure to proteinase K (orange), DNase I (purple), Alginate Lyase (green) and sodium metaperiodate (blue). **** indicates a p value < 0.0001; *** indicates a p value < 0.001; ns indicates a non-significant p value (>0.05) in two-tailed unpaired Mann–Whitney test compared to the untreated condition. Error bars indicate standard deviation.
