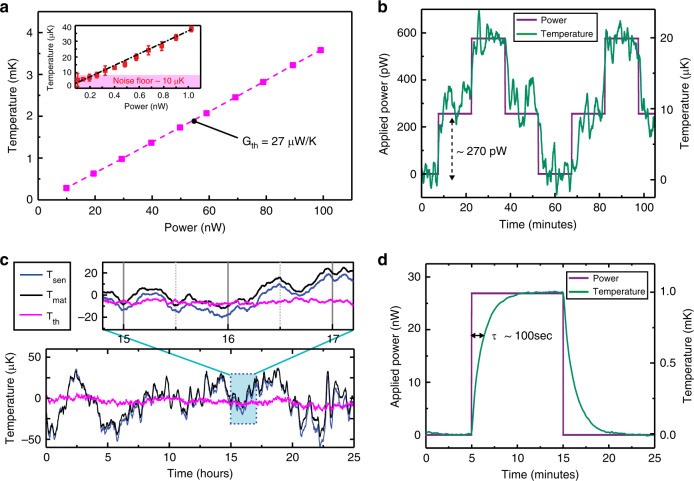
Fig. 2. Thermal characterization of the calorimeter.
a Thermal conductance characterization (Gth) performed at a flow rate of 100 nl min−1: temperature rise (ΔTth) of the center of the sensing capillary tube as a function of the DC power input is plotted, resulting in Gth of ∼27 µW K−1 (magenta squares). The inset shows the temperature rise for sub-nW level inputs that result in a smaller temperature rise (0–40 µK). The data represent the mean value of four different measurements and the error bars represent the standard deviation (±SD). From the observed standard deviation of (±5 µK) we estimate a noise floor of ∼10 µK. b Validation of thermal resolution. A thermal pulse (purple solid line) with steps of 270 pW applied on the capillary (see Methods) resulted in a corresponding 10 µK rise on the temperature signal (green solid line), validating our calorimeter’s capability to resolve at least 270 pW (heat resolution). c Temperatures of both the capillaries (Tmat in solid black, Tsen in solid blue) without any sample in the sensing capillary tube are plotted for a 25-hour timespan, indicating fluctuations of ±5 µK in the differential signal (Tth in solid magenta). A 2 hour window (blue box) clearly shows that Tmat follows Tsen, indicating a common-mode radiative coupling to the outer shield. d Time constant of the sensing capillary tube. A square thermal pulse (purple solid line) in steps of ~27 nW results in a first order temperature response with a time constant of ~1.5 min.

