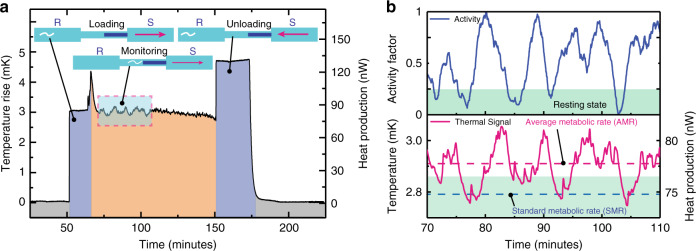
Fig. 3. C. elegans metabolic heat output measurement and analysis.
a A typical procedure to measure heat output from a single C. elegans involves establishing an initial reference (gray region), followed by loading the worm (violet region) from the reservoir side (R) with a syringe pump (S) at withdraw flow rates (R → S) of ~2–10 µl min−1. The orange region indicates the monitoring phase (1–2 h), followed by unloading (R ← S, violet region) at flow rates of ~2–10 µl min−1. b Temperature rise (magenta plot in bottom panel) and activity factor (blue plot in top panel) of a reference measurement (marked blue region in Fig. 3a). In the panel showing the activity factor, the worm’s resting activity level is highlighted in green. From the corresponding metabolic signal, SMR (blue dashed line, bottom panel) is derived. AMR (magenta dashed line, bottom panel) is determined by averaging the thermal signal in a 30-minute time interval.

