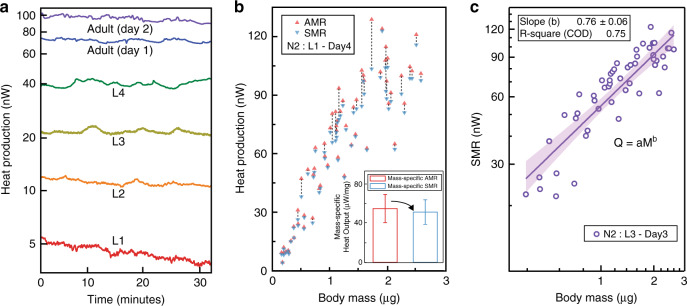
Fig. 4. Size-dependent metabolic heat output measurements on N2 wild-type.
a Real-time metabolic heat output profiles of referential C. elegans from L1 stage to Adult (Day 2) stage. b Metabolic heat output measurements of N2 wild-type worms (n = 61 independent trials) at different stages from L1 to Adult (Day 4). The red and blue triangles represent the AMR and SMR of individual worms, respectively, and are connected by a black dashed line to identify measurements from individual worms. The inset shows the mass-specific AMR (red) and SMR (blue) averaged over 61 N2 wild-type worms while the error bars represent the standard deviation (±SD) about the mean. c SMR vs. body size on a log-log plot to extract an allotropic scaling constant of 0.76 from (n = 52 independent trials) wild-type N2 samples from L3 to Adult (Day 3). The purple solid line represents the best-fit with R-squared error of 0.75. The purple shaded region indicates the 95% confidence interval.

