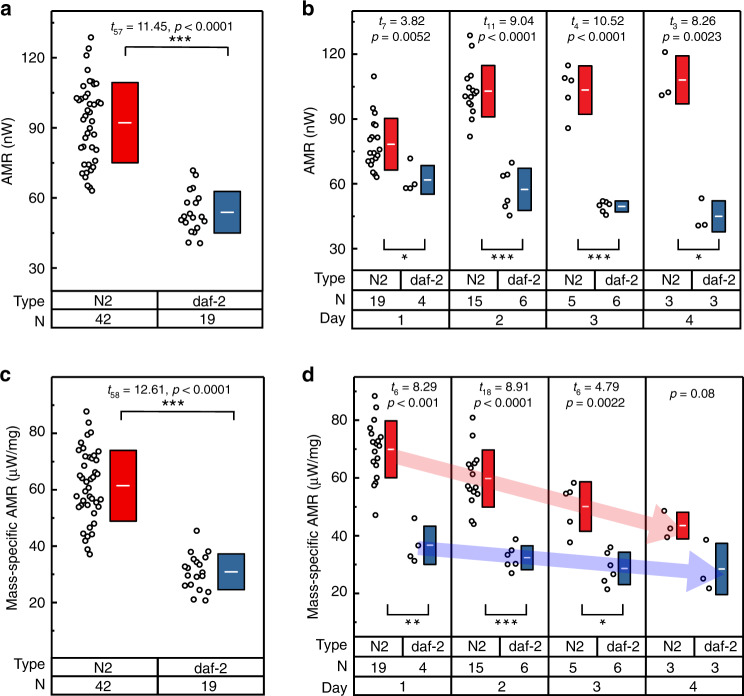
Fig. 5. Age-dependent metabolic heat output measurements on N2 wild-type and daf-2 mutant.
a AMR from 42 worms of wild-type and 19 worms of daf-2 from Day 1–4. The white line in the center of the box represents the mean value of the corresponding set, whereas the height of the box represents the standard deviation (±SD). N indicates the corresponding number of samples. b AMR of several worms (black circles) of wild-type (red) and daf-2 (blue) from Adult Day 1–4. c Mass-specific AMR of the sample set in Fig. 5a. d Mass-specific AMR is plotted for the same sample set in Fig. 5b. Statistical analysis was performed using two-tailed t test. Statistical significance was determined for p < 0.05; *p < 0.01, **p < 0.001, ***p < 0.0001.

