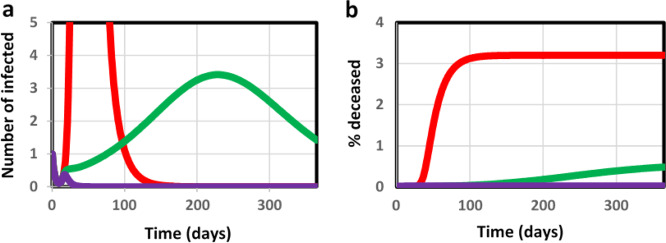
Fig. 2. Predicted progression of the epidemic.
Predicted progression of epidemic during the first year in terms of a number of infected that test positively and b the % deceased individuals due to the virus; without government action (red), with social distancing at factor 2.2 (green) and with complete lockdown (i.e., social distancing factor of 10; purple). Lockdown measures were taken at t=15 days; hence the curves coincide before this time.

