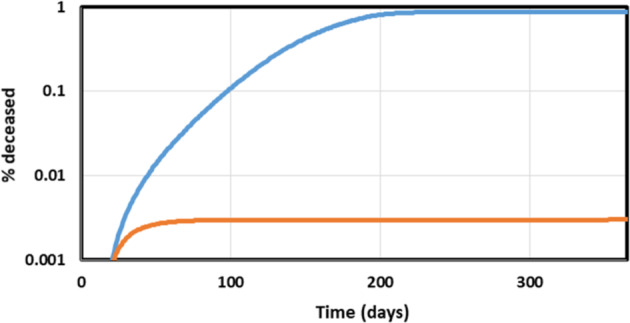
Fig. 6. The effects of the sequence of lockdown on the fraction of the population dying from the disease as a function of time.

At time 15 days a lockdown was instated either of social distancing factor 2 (‘soft’) or of social distancing factor 10 (‘strong’). At time 190 days the lockdown intensity was altered to a social distancing factor of 10 and 2, respectively. The ‘soft-then-strong’ lockdown strategy is shown by the blue line, the ‘strong-then-soft’ strategy by the orange line.
