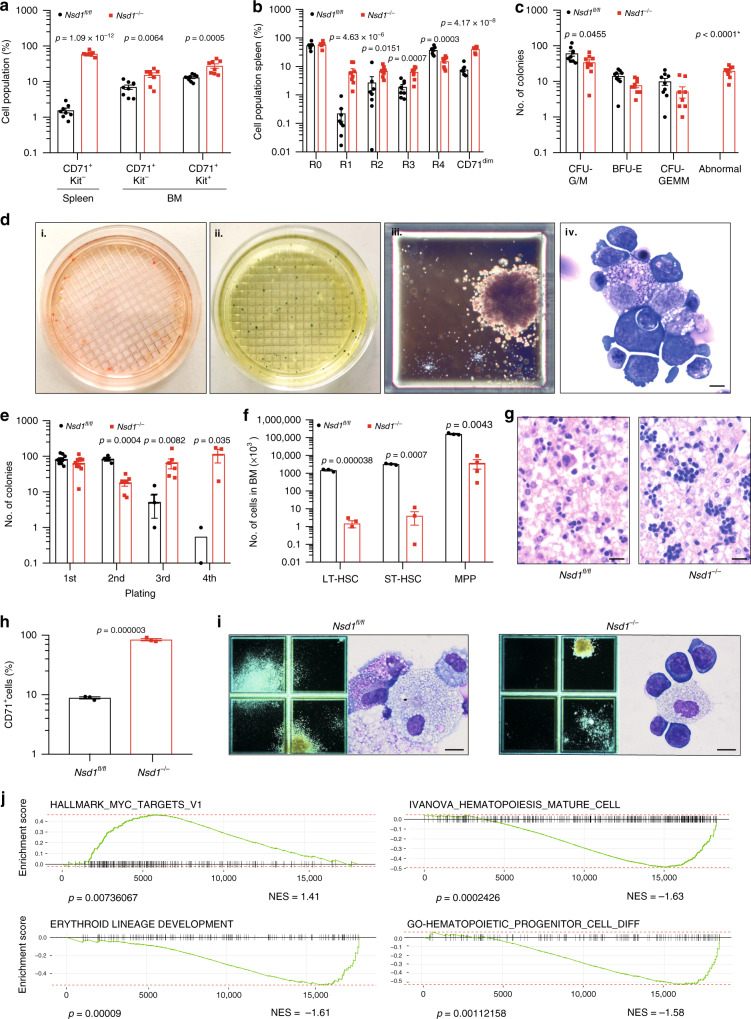
Fig. 3. Cellular and molecular characterization of the erythroleukemia-like disease of Nsd1−/− mice.
a CD71+ and Kit+ cell populations (given in %) in single-cell suspensions of spleen and BM of healthy Nsd1fl/fl (spleen, n = 8, BM, n = 9, black bars) and diseased Nsd1−/− mice (spleen, n = 8; BM, n = 8, red bars). b Comparative flow cytometric analysis of erythroid maturation (R1–R4) of single-cell suspensions of total BM of healthy Nsd1fl/fl (n = 9, black bars) and diseased Nsd1−/− mice (n = 9, red bars). c Colony types formed by 4 × 10⁴ BM cells of Nsd1fl/fl (n = 9, black bars) and Nsd1−/− mice (n = 9, red bars) in growth-factor-containing MC (M3434). * indicating a p value smaller than 1 × 10⁻¹⁵. d Representative images (illustrating one out of four experiments) of MC (M3434) cultures of Nsd1−/− BM cells demonstrating (i) abnormal large red colonies, (ii) partially benzidine-staining-positive colonies, (iii) a large dense isolated colony, and (iv) Wright Giemsa-stained cytospin of an isolated colony (×4 and ×1000, size bar = 10 μM). e Number of colonies in four consecutive rounds of plating in MC (M3434) formed by 4 × 10⁴ BM cells of Nsd1fl/fl (black dots; 1st plating: n = 9, 2nd plating: n = 4, 3rd plating: n = 3, 4th plating: n = 2) and Nsd1−/− mice (red squares; 1st plating: n = 9, 2nd plating: n = 7, 3rd plating: n = 6, 4th plating: n = 3). f Number of LT-HSC, ST-HSC, and MPP (×104) in lineage-marker-depleted single-cell BM suspensions of Nsd1fl/fl (n = 3, black bars) and Nsd1−/− mice (n = 4, red bars) relative to the total number of lineage-depleted cells obtained during each procedure. g Representative HE-stained biopsies of E19.5 fetal livers from a Nsd1fl/fl (left panel, illustrating one out of two experiments) and Nsd1−/− (right panel, illustrating one out of four experiments) mouse (×400, size bar = 10 μM). h CD71+ cells (%) in E19.5 fetal livers of Nsd1fl/fl (n = 3, black bar) and Nsd1−/− (n = 3, red bar) mice. i Representative images of colonies in MC cultures (M3434) and Wright Giemsa-stained cytospin preparations from 4 × 10⁴ E17.5 fetal liver-derived hematopoietic cells of Nsd1fl/fl (left panels, illustrating one out of three experiments) and Nsd1−/− (right panels, illustrating one out of three experiments) mice (×2 and ×1000, size bars = 10 μM). j Gene set enrichment analysis (GSEA) (weighted Kolmogorov–Smirnov-like statistics, two-sided, with adjustment for multiple comparisons) of selected signatures of differentially expressed gene between Nsd1−/− mice (n = 5) and littermate controls (n = 3). Values are presented as individual points, bar graphs represent the mean value of biological replicates, error bars as standard error of the mean. Statistical significances in a–c, e, f, h was tested with unpaired two-tailed t-test.

