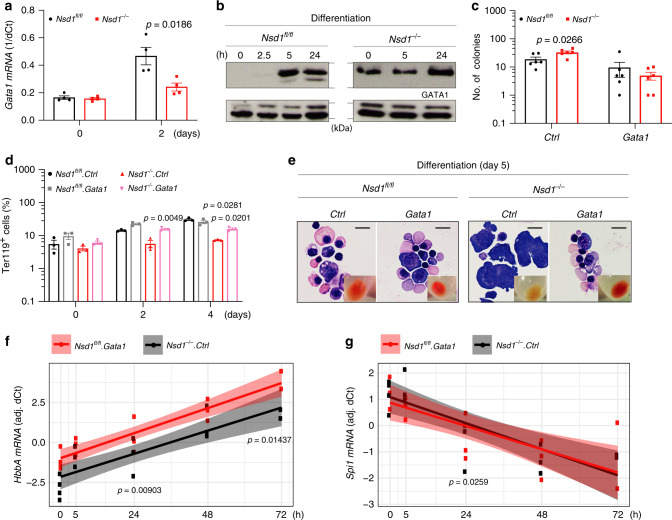
Fig. 5. Aberrant regulation of GATA1 expression in Nsd1−/− erythroblasts.
a Relative Gata1 mRNA expression levels (1/dCt) in BM-derived erythroblasts from Nsd1fl/fl (n = 4, black bars) and Nsd1−/− mice (n = 4, red bars) in maintenance medium (day 0) and after 2 days in differentiation medium. Ct values were normalized to Gapdh expression. b GATA1 protein levels in Nsd1fl/fl (left panels) and Nsd1−/− (right panels) BM-derived erythroblasts expanded in maintenance medium (0 h) and in differentiation medium (2.5, 5, and 24 h). LAMIN-A/C was used as immunoblot loading control for nuclear proteins (one out of two experiments). c Number of colonies formed by 5 × 10³ lineage-marker-depleted BM-derived erythroblasts in MC (M3434) from Nsd1fl/fl (black bars) and Nsd1−/− mice (red bars) transduced with pMSCV-puro (Ctrl) or pMSCV-mGata1-puro (Gata1) (n = 6 per group). d Ter119 expression (Ter119+, in %) in maintenance medium (0 h) and after 2 and 4 days in differentiation medium of Nsd1fl/fl (black and gray bars) and Nsd1−/− (red and pink bars) BM-derived erythroblasts transduced with control virus (Ctrl, black and red bars) or Gata1-expressing virus (Gata1, gray or pink bars) (n = 3 per group). e Representative images (one out of two experiments) of Wright Giemsa-stained cytospin preparations and cell pellets (small insets) of Nsd1fl/fl and Nsd1−/− BM-derived erythroblasts transduced with control virus (Ctrl) or Gata1-expressing virus (Gata1) after 5 days in differentiation medium (×600, size bars = 10 μm). f HbbA and g Spi1 mRNA levels in BM-derived Nsd1−/− BM-derived erythroblasts transduced with control virus (Ctrl, black dots) or Gata1-expressing virus (Gata1, red dots) measured 0, 5, 24, 48, and 72 h in differentiation medium. Values are residual ΔCT relative to Gapdh, after adjustment for effect of individual mouse (Tukey test for difference in expression between transductions at 24 h in linear model with interaction between time a and transduction, adjusting for effect of mouse, two-sided, adjusted for multiple comparisons). Values are presented as individual points, bar graphs represent the mean value of biological replicates, error bars as standard error of the mean. Statistical significances in a, c was tested with unpaired two-tailed t-test. Statistical significance in d was tested with either unpaired (Nsd1fl/fl.Gata1 vs. Nsd1−/−.Gata1) or paired (Nsd1−/−.Ctrl vs. Nsd1−/−.Gata1) two-tailed t-test. Statistical significance in f, g was tested using Tukey test for difference in expression between transductions at 24 h in linear model with interaction between time a and transduction, adjusting for effect of mouse.

