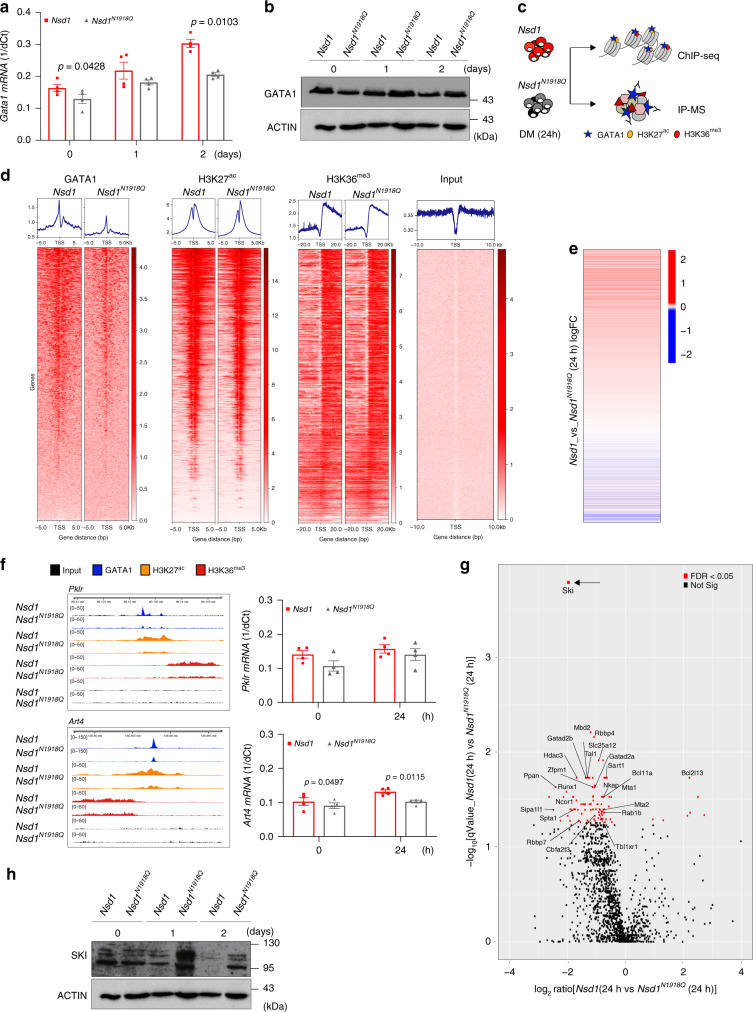
Fig. 8. Nsd1 expression increases GATA1 chromatin binding and changes GATA1 protein interaction partners during induced differentiation of Nsd1−/− cells.
a Relative Gata1 mRNA expression levels (1/dCt) in Nsd1−/− BM-derived erythroblasts virally expressing Nsd1 (red bars) or Nsd1N1918Q (gray bars) expanded in maintenance medium (day 0) or after 1 and 2 days in differentiation medium. Values were normalized to Gapdh (n = 4 per group). b Western blot showing GATA1 protein expression in 1 × 10⁶ Nsd1−/− BM-derived erythroblasts expressing Nsd1 or Nsd1N1918Q upon expansion in maintenance medium (day 0), and after 1 and 2 days in differentiation medium. Actin was used as a loading control. This data represents one of two experiments. c Experimental setup of the ChIP-seq and IP-MS experiment. d Heatmaps of genome-wide ChIP-seq signals in Nsd1−/− BM-derived erythroblasts expressing Nsd1 (left column) or Nsd1N1918Q (right column) after 24 h in differentiation medium for GATA1, H3K27ac, and H3K36me3. All heatmaps are sorted decreasingly according to read coverage around transcriptional start sites (TSS) of GATA1 (leftmost). Input denotes sheared non-immunoprecipitated DNA (rightmost), serving as visual control. Density plots above each heatmap depicts corresponding averaged binding around TSS. e One-dimensional heatmap of logFC between gene expression of Nsd1−/− BM-derived erythroblasts expressing Nsd1 or Nsd1N1918Q after 24 in differentiation medium (as presented in Fig. 5h, j) sorted according to read coverage around TSS for H3K27ac ChIP (data as shown in panel c, sorted independently. Only overlapping genes are displayed). f Integrated genome viewer (IGV) representation of GATA1, H3K27ac, and H3K36me3 ChIP peaks in the Pklr (top panel) and Art4 gene locus (lower panel) from Nsd1−/− BM-derived erythroblasts either expressing Nsd1 or Nsd1N1918Q after 24h in differentiation medium. Right panels show Pklr and Art4 mRNA relative expression levels (1/dCt) in Nsd1−/− BM-derived erythroblasts expressing Nsd1 or Nsd1N1918Q in maintenance medium (day 0) and after 24 h differentiation medium. Values are shown as relative expression normalized to Gapdh (n = 4). g Volcano plot of differential protein enrichments by GATA1 immunoprecipitation (GATA1-IP) in Nsd1−/− BM-derived erythroblasts either expressing Nsd1 or Nsd1N1918Q kept for 24h in differentiation medium, each group is normalized to IgG control (n = 2). Significantly reduced GATA1-SKI association (indicated by a black arrow) was observed upon expression of Nsd1 compared to Nsd1N1918Q (FDR < 0.05). h Western blot analysis showing SKI protein expression in 1 × 10⁶ BM-derived Nsd1−/− erythroblasts either expressing Nsd1 or Nsd1N1918Q during expansion in maintenance medium (day 0), and after 1 and 2 days in differentiation medium. Actin was used as a loading control. This data represent one of two experiments. Values are presented as individual points, bar graphs represent the mean value of biological replicates, error bars as standard error of the mean. Statistical significances in a, f tested with a paired two-tailed t-test.

