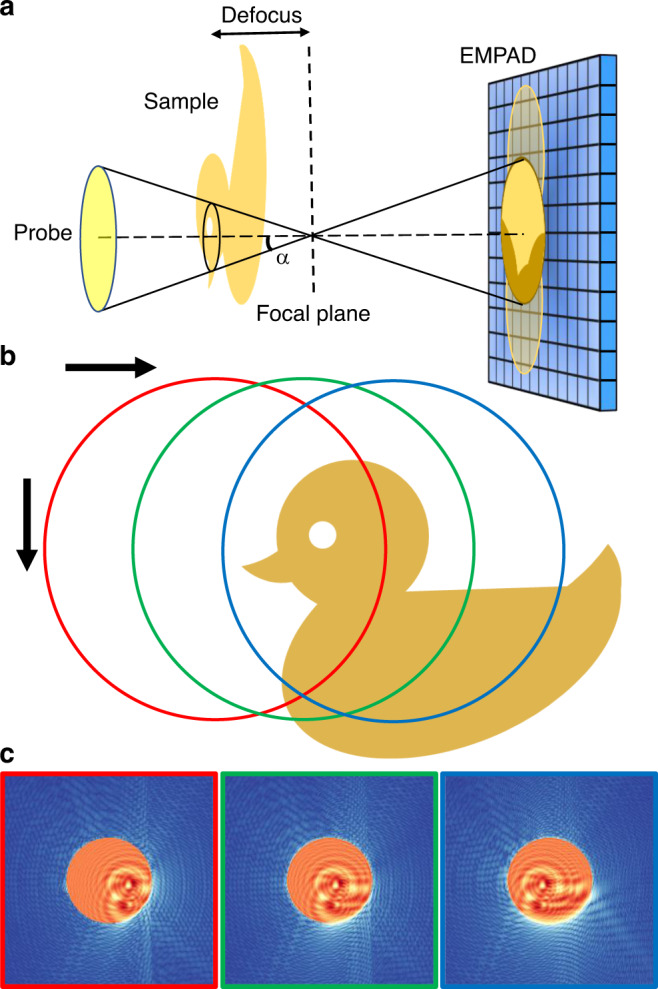
Fig. 1. Schematic of defocused probe electron ptychography.

a Experimental setup. The focus of the electron probe is downstream from the sample at a distance defined by the defocus value. The diffraction pattern on the detector (EMPAD) shows a shadow image in the bright-field disk. b A diagram of the scan procedure. c Three diffraction patterns simulated when the probe is illuminated at the positions circled in b, which show the shadow images in the bright-field disk shifting accordingly with the probe position. The speckles in the dark-field region contain high frequency information.
