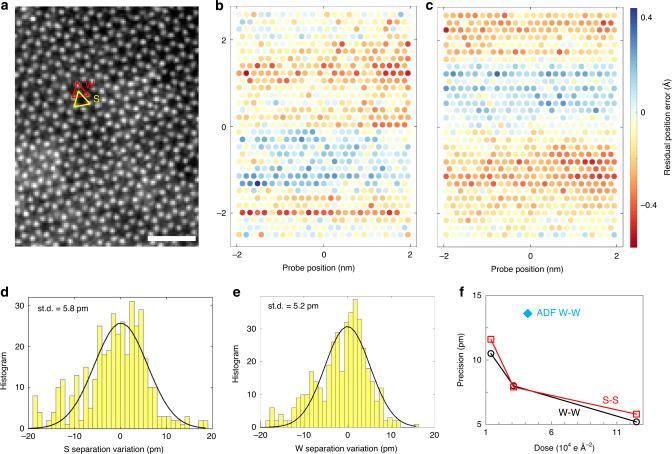
Fig. 5. Measurement precision of atomic distance.
a A ptychographic reconstruction from a monolayer WS2 sample using illumination dose of 1.25 × 10⁵ e Å−2. W–W and S–S sublattices are labeled with a red and yellow triangle respectively. Scale bar is 1 nm. b, c Residual probe position errors along horizontal and vertical direction estimated by ptychography. The original probe position is shown as circles and the random position error is displayed by the false color. d, e. Statistical distribution of S–S and W–W atomic separations. f Precision of W–W and S–S distance in dependence on the illumination dose. Precision of W–W distance from a conventional ADF image with a dose 4.2 × 10⁴ e Å−2 denoted by a diamond symbol on f.

