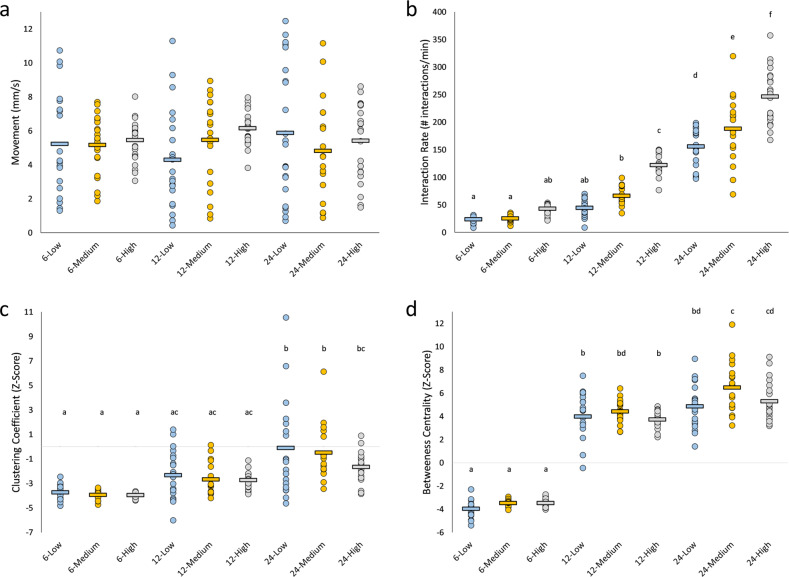
Fig. 1. Behavioural properties of male flies at different densities and group sizes.
Dots represent a single trial for groups of 6, 12 and 24 flies at low (blue), medium (orange) and high (grey) densities. The mean for each group size-density treatment is indicated by a horizontal line. Letters indicate statistical significance (α = 0.008) after outlier removal (Supplementary Fig. 3). a Movement. Movement does not change across different group sizes and densities. Density: F(2,183) = 0.96, p = 0.386; Group size: F(2,183) = 0.02, p = 0.982; Density × Group size: F(4,183) = 1.52, p = 0.198. Group size 6: low—n = 20, medium—n = 21, high—n = 23; Group size 12: low—n = 22, medium—n = 20, high—n = 21; Group size 24: low—n = 23, medium—n = 19, high—n = 23. b Interaction rate. Interaction rates increase with increasing density and group size. Density: F(2,184) = 78.27, p < 0.008; Group size: F(2,184) = 538.27, p < 0.008; Density × Group size: F(4,184) = 9.39, p < 0.008. Group size 6: low—n = 20, medium—n = 21, high—n = 24; Group size 12: low—n = 22, medium—n = 20, high—n = 22; Group size 24: low n = 22, medium = 19, high = 23. c Clustering coefficient. Flies in groups of 6 and 12 have lower clustering coefficient than groups of 24 flies. There is no effect of density on clustering coefficient. Density: F(2,176) = 2.70, p = 0.070; Group size: F(2,176) = 47.50, p < 0.008; Density × Group size: F(4,176) = 1.10, p = 0.360. Group size 6: low n = 20, medium = 21, high = 21; Group size 12: low n = 21, medium = 20, high = 22; Group size 24: low n = 22, medium = 17, high = 21. d Betweeness centrality. Flies in groups of 6 have lower betweeness centrality than groups of 12 and 24 flies. Density: F(2,178) = 6.03, p < 0.008; Group size: F(2,178) = 809.95, p < 0.008; Density × Group size: F(4,178) = 1.76, p = 0.140. Group size 6: low n = 20, medium = 21, high = 23; Group size 12: low n = 20, medium = 19, high = 22; Group size 24: low n = 21, medium = 18, high = 23.

