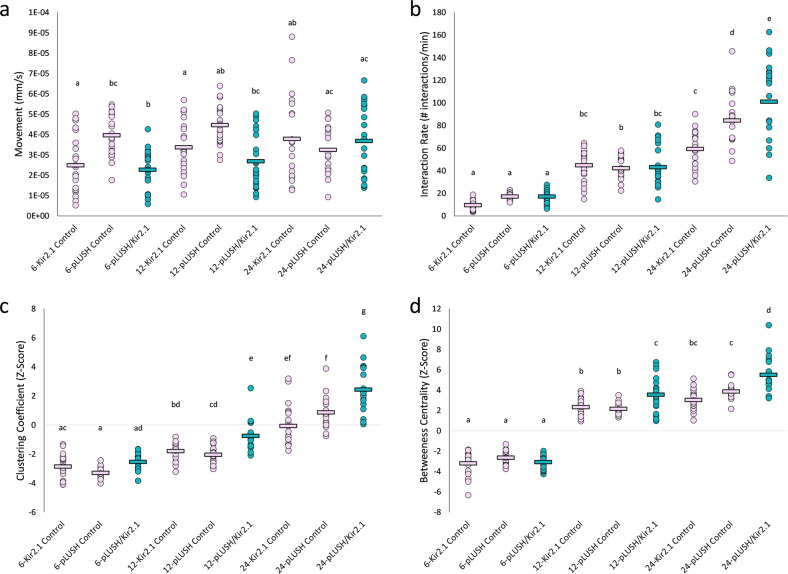
Fig. 2. Behavioural properties of male flies with inhibited lush-expressing cells at different group sizes.
Dots represent a single trial for groups of 6, 12 and 24 flies for UAS-Kir2.1 control flies (pink), lush-GAL4 control flies (pink) and silenced lush flies (turquoise) at medium density. The mean for each group size-genotype is indicated by a horizontal line. Letters indicate statistical significance (α = 0.008) after outlier removal (Supplementary Fig. 4). a Movement. The movement for the silenced lush flies (turquoise) is the same as at least one of their respective controls (pink) for each group size. Genotype: F(2,184) = 6.15, p < 0.008; Group size: F(2,184) = 4.61, p = 0.011; Genotype × Group size: F(4,184) = 6.93, p < 0.008. Group size 6: UAS-Kir2.1 Control—n = 22, Gal4 Control—n = 22, Experimental—n = 22; Group size 12: UAS-Kir2.1 Control—n = 22, Gal4 Control—n = 21, Experimental—n = 22; Group size 12-UAS-Kir2.1 Control n = 21, Gal4 Control = 19, Experimental = 22. b Interaction rate. The interaction rates for the silenced lush flies (turquoise) are the same as at least one of their respective controls (pink) for each group size. Genotype: F(2,183) = 13.39, p < 0.008; Group size: F(2,183) = 229.88, p < 0.008; Genotype × Group size: F(4,183) = 9.2, p < 0.008. Group size 6: UAS-Kir2.1 Control—n = 22, Gal4 Control—n = 22, Experimental—n = 22; Group size 12: UAS-Kir2.1 Control—n = 22, Gal4 Control—n = 21, Experimental—n = 22; Group size 24: UAS-Kir2.1 Control n = 20, Gal4 Control = 19, Experimental = 22. c Clustering coefficient. Silenced lush flies (turquoise) in groups of 6 do not differ in clustering coefficient from their controls (pink). When in groups of 12 and 24, silenced lush flies have higher clustering coefficient than their controls. Genotype: F(2,167) = 30.68, p < 0.008; Group size: F(2,167) = 243.49, p < 0.008; Genotype × Group size: F(4,167) = 6.63, p < 0.008. Group size 6: UAS-Kir2.1 Control—n = 20, Gal4 Control—n = 20, Experimental—n = 21; Group size 12: UAS-Kir2.1 Control—n = 19, Gal4 Control—n = 21, Experimental—n = 18; Group size 24: UAS-Kir2.1 Control—n = 20, Gal4 Control—n = 18, Experimental—n = 19. d Betweeness centrality. Silenced lush flies (turquoise) in groups of 6 do not differ in betweeness centrality from their controls (pink). When in groups of 12 and 24, silenced lush flies have higher betweeness centrality than their controls. Genotype: F(2,172) = 18.52, p < 0.008; Group size: F(2,172) = 710.79, p < 0.008; Genotype × Group size: F(4,172) = 9.28, p value < 0.008. Group size 6: UAS-Kir2.1 Control—n = 22, Gal4 Control—n = 20, Experimental—n = 21; Group size 12: UAS-Kir2.1 Control—n = 21, Gal4 Control—n = 21, Experimental—n = 20; Group size 24: UAS-Kir2.1 Control—n = 19, Gal4 Control—n = 18, Experimental—n = 19.

