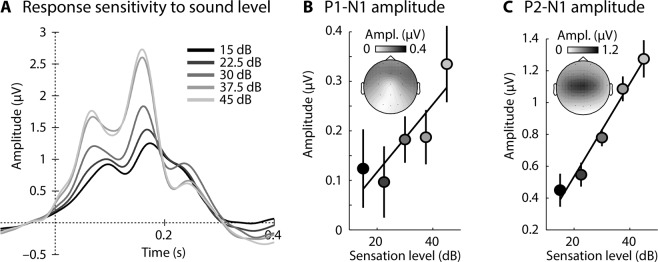
Figure 3.
Overall response sensitivity to sound level (across sound-level contexts). (A) Response time courses for five different sound-level categories (averaged across a fronto-central electrode cluster). (B) P1-N1 peak-to-peak amplitude for each sound level. The solid line reflects the averaged slope of the linear fit. Error bars reflect the standard error of the mean (removal of between-subject variance67). (C) Same as in panel B for P2-N1 peak-to-peak amplitude.

