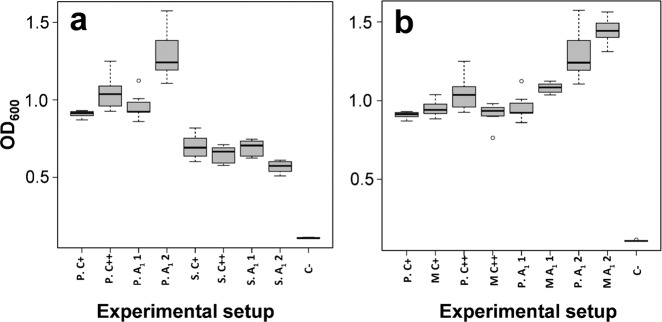
Fig. 4. Box plot of biofilm formation capacity for cells treated with stieleriacine A1.
a Box plot of biofilm formation capacity of P. inhibens (P) and S. dubius (S). b Box plot of biofilm formation capacity of P. inhibens (P) compared to P. inhibens ΔluxR transposon mutant (M). Experimental setup: P.C+: P. inhibens in MB medium; P.C++: P. inhibens in MB with acetone; P.A11: P. inhibens in MB with stieleriacine A1 1.34 µM in acetone; P.A12: P. inhibens in MB with stieleriacine A1 134 µM in acetone; S.C+: S. dubius in MB medium; S.C++: S. dubius in MB medium with acetone; SA11: S. dubius in MB with stieleriacine A1 1.34 µM in acetone; S.A12: S. dubius in MB with stieleriacine A1 134 µM in acetone; M.C+: ΔluxR transposon mutant in MB medium; P.C++: ΔluxR transposon mutant in MB with acetone; MA11: ΔluxR transposon mutant in MB with stieleriacine A1 1.34 µM in acetone; MA12: ΔluxR transposon mutant in MB with stieleriacine A1 134 µM in acetone; C−: MB medium. For each experiment, four biological replicates and two technical replicates were performed. The minimum and maximum value, sample median, and the first and third quartiles are shown (box-and-whisker plot).

