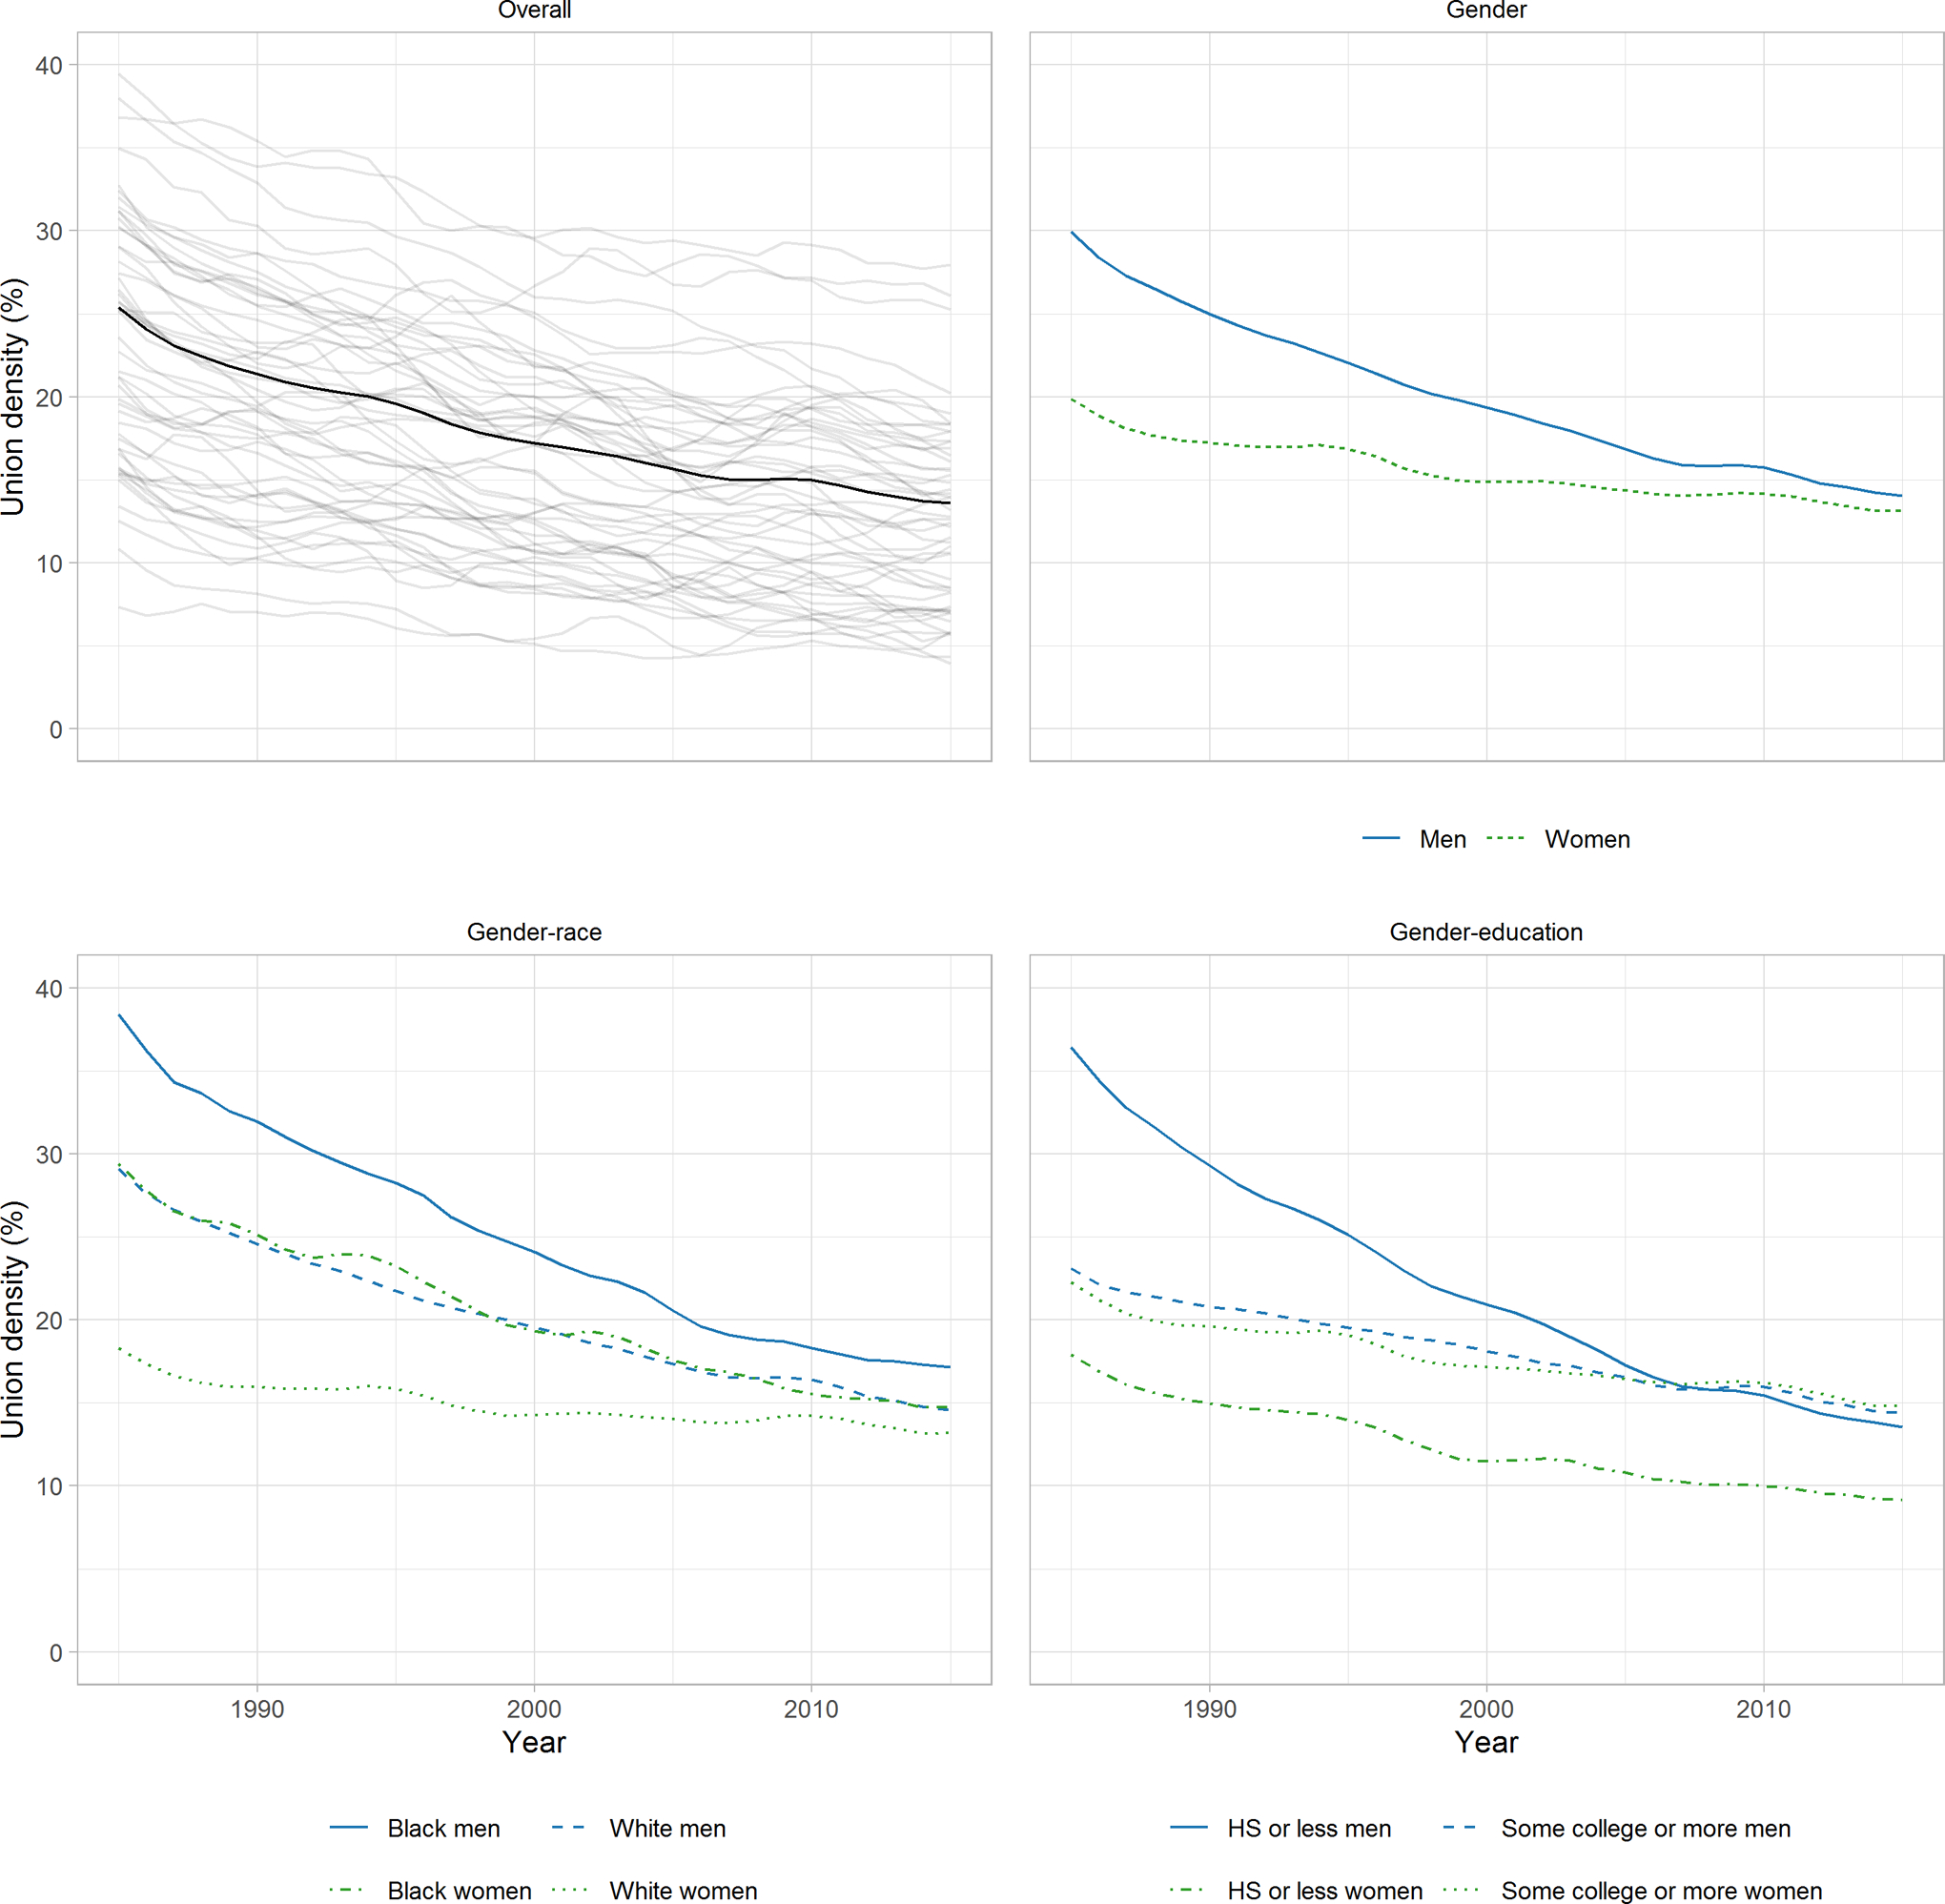
Figure 2.

Three-year moving average union density in the United States from 1985 to 2015 among 25-to-64-year-old wage and salary workers overall (with state-specific trends shown in grey), as well as by gender, gender-race, and gender-education. Note: Union density is the proportion of wage and salary workers covered by a labor-union contract, which we estimated from the Current Population Survey’s Merged Outgoing Rotation Group files maintained by the Center for Economic Policy Research.
