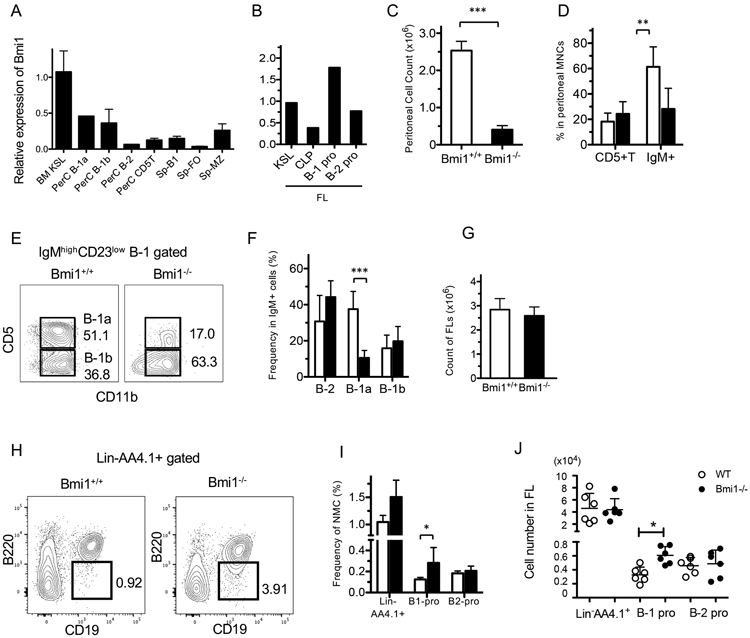
Figure 1. Peritoneal B-1a cells have higher Bmi1 dependency than other lymphoid subsets.

A. Bmi1 mRNA expression measured by qPCR in various sorted populations from adult BM, peritoneal cells (PerC), or spleen (Sp). KLS: kit+Sca-1+lin− HSC population, FO: follicular B-cells, MZ: marginal zone B-cells. B. Bmi1 expressions in various fetal liver (FL) progenitor populations. CLP: common lymphoid progenitors. C. Marked reduction of peritoneal cell count in Bmi1−/− mice (n=6, p<0.001). D. The frequency of IgM+ B-cell and CD5+ T-cells in the WT and Bmi1−/− peritoneal cavity is depicted (n=5, ** p<0.01). E. Representative FACS plots for peritoneal B-1a cells in WT and Bmi1−/− mice are depicted. F. The frequency of B-cell subsets among the peritoneal IgM+ cells is depicted. The percentage of B-1a cells is reduced (n=5, ***p<0.001). (G-J) Total cell number of FLs (G), representative FACS plots for lin−AA4.1+CD19+B220− B-1 progenitor population in the FL (H), the frequency (I) and absolute number (J) of FL B-1 and B-2 progenitor cells in WT and Bmi1−/− embryos are depicted. B-1 progenitor cell number is increased in the Bmi1−/− FL (n=6, *p<0.03). White bar & circle: WT, black bar & circle: Bmi1−/−. All data were obtained from experiments more than 3 times.
