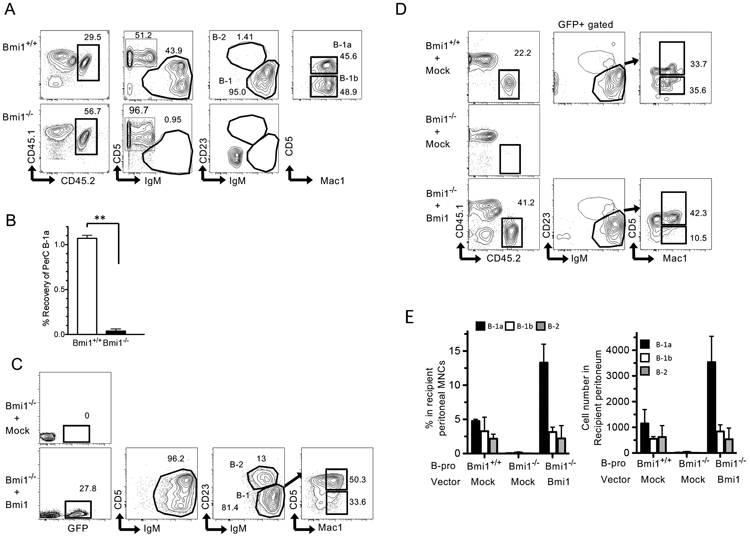
Figure 2. Loss of B-1a self-renewal by Bmi1 disruption.

A: Representative FACS plots of recipient peritoneal cells at 12 weeks post-transplant. The peritoneal cells of the recipient NSG mice transplanted with Bmi1+/+ (upper panel) or Bmi1−/− (lower panel) peritoneal cells are depicted (n=3). B: Recovery ratio of WT and Bmi1−/− B-1a cells after transplantation, calculated by (number of recovered B-1a cells)/ (number of injected B-1a cells) 12 weeks after transplantation (n=3 for each group). Around 4000-80000 B-1a cells were injected. C: Retrovirus with mock or Bmi1 vector was infected into Bmi1−/− FL Lin− cells. Subsequently, infected cells were transplanted into sub-lethally irradiated (250 rad) NSG mice. Representative FACS plots at 4 months post-transplant are depicted (n=3). D: WT and Bmi1−/− FL B-1 progenitor cells with a mock or Bmi1-overexpressing retrovirus were injected into sub-lethally irradiated NSG mice. The recipient peritoneal cell analysis 4 months after transplantation is depicted (n=3). E: The percentage (left) and cell number (right) of donor-derived B-cell population in the peritoneal cavity of NSG mice transplanted with Bmi1−/− FL B-1 progenitor cells with or without Bmi1-overexpressing vector are depicted (n=3). All data were obtained from experiments more than 3 times.
