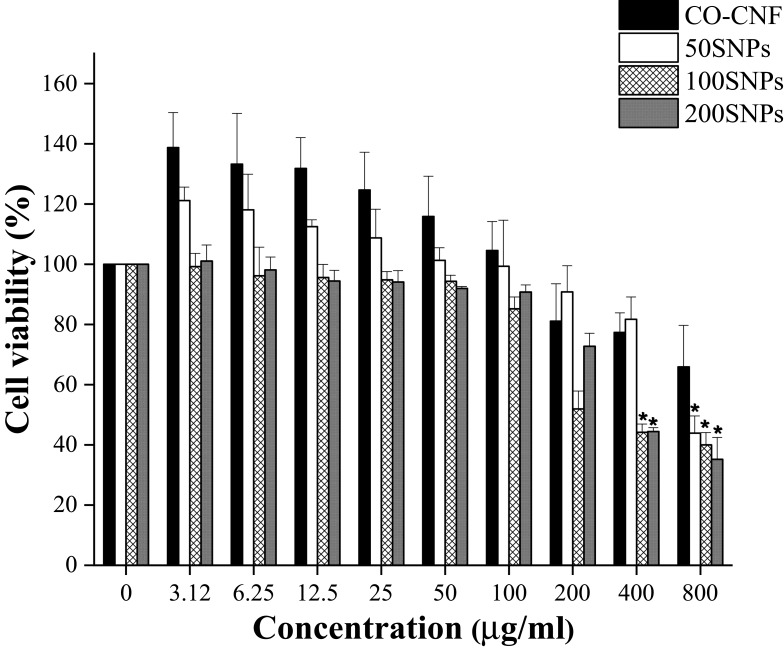
Figure 8.
Cell viability of CO-CNF, 50 SNPs, 100 SNPs, and 200 SNPs. Data are expressed as mean ± SD. (n=3). The asterisk (*) indicated the significant differences of the groups from the control group (0 µg/mL) at p < 0.05 analyzed by Tukey’s test.
Abbreviations: CO-CNF, ĸ-carrageenan oligosaccharides linked cellulose nanofibers; 50 SNPs, 50 mg surfactin-loaded CO-CNF nanoparticles; 100 SNPs, 100 mg surfactin-loaded CO-CNF nanoparticles; 200 SNPs, 200 mg surfactin-loaded CO-CNF nanoparticles.

