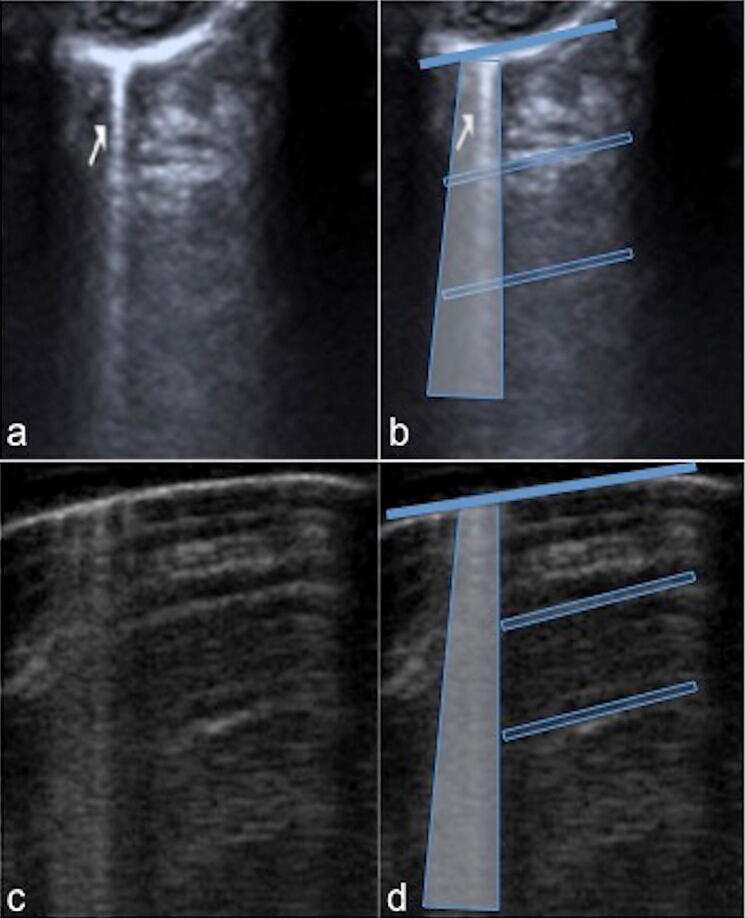
Fig. 8.
Chest ultrasound examination performed with a high-frequency linear probe (15–7 MHz). Z-line (a) and B-line (c) with schematic representation (b–d) in two different healthy patient (a, c): hyperechogenic linear structures (a arrow) come from the hyperechoic pleural line (b thickened blue line) caudally for few cm (b transparent blue vertical trapezoid) without deleting the A-lines (b transparent blue box). Otherwise, the B-lines extend deeper than Z-line (d blue vertical trapezoid) and deletes the A-lines (d transparent blue box)

