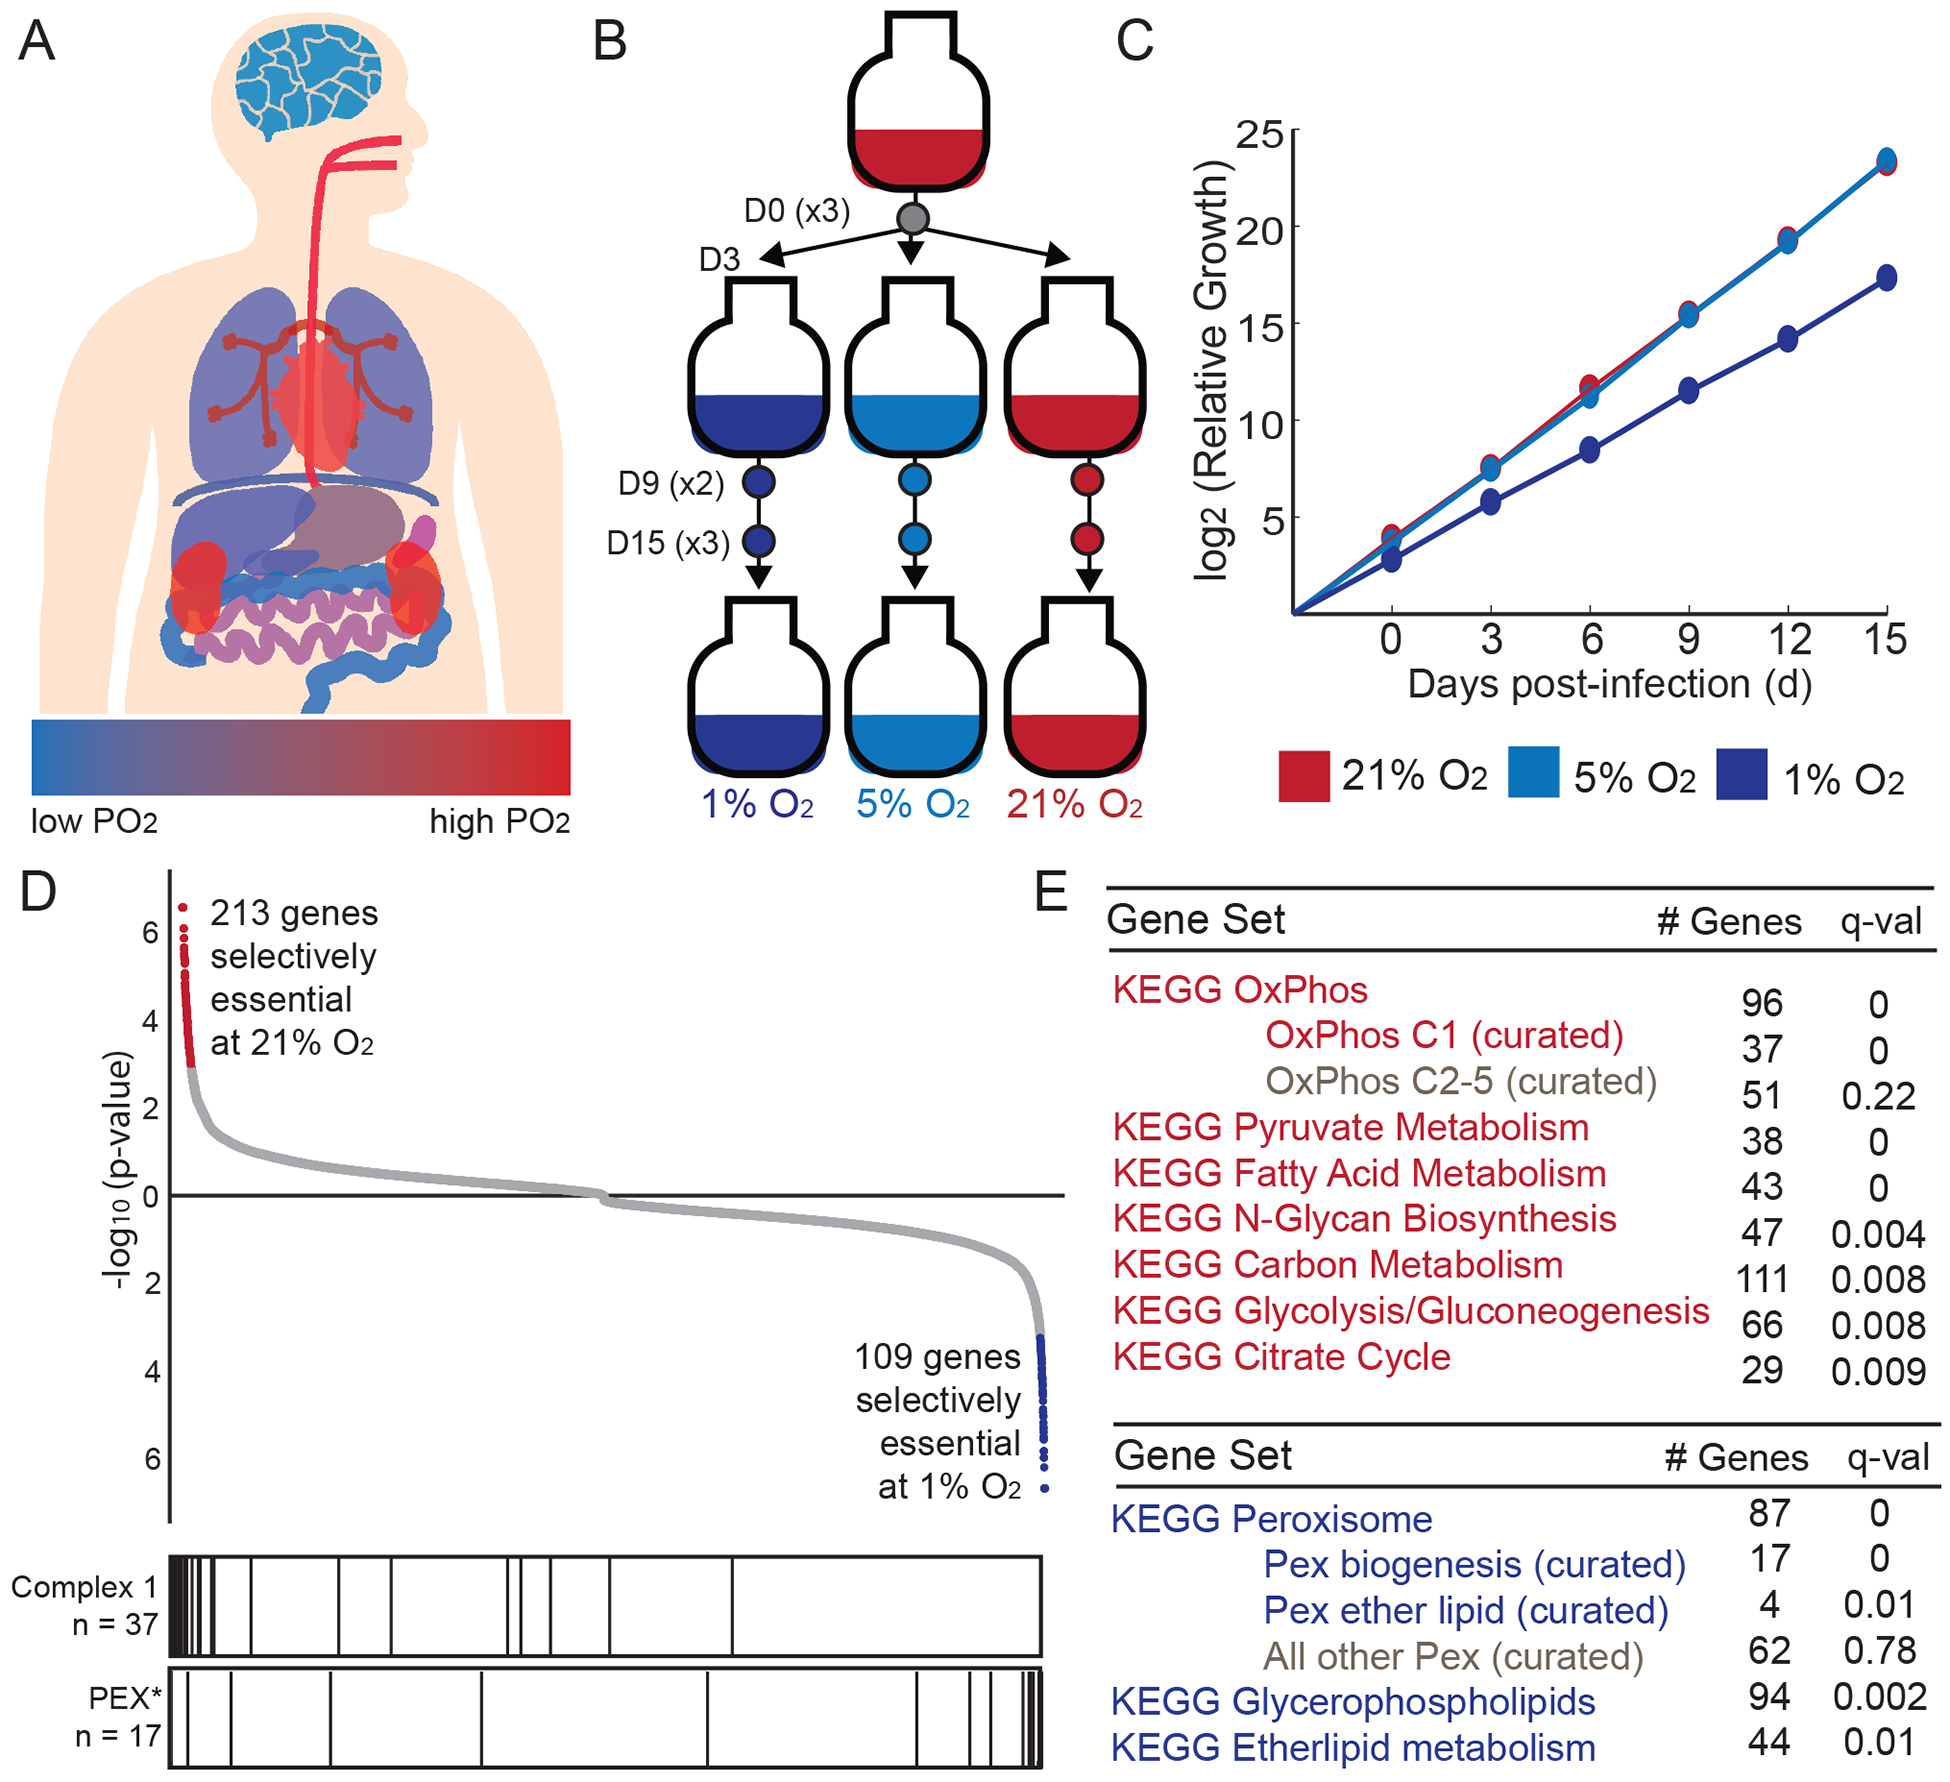
Figure 1. Genome-wide screen identifies genes that are selectively essential as a function of oxygen levels.

(A) Approximate tissue PO2 values across the human body (Carreau et al., 2011); blue for low PO2 and red for high PO2. (B) Experimental design for genome-wide screen. Three environmental oxygen tensions were tested at Day 0, 9 and 15 of treatment (n = 3 per D15 and D0 time points, n = 2 for D9 time points). (C) Cumulative relative growth throughout screens for cells exposed to 1, 5, 21% O2 (average shown for all technical replicates, curves at 21% and 5% overlap). (D) All 20,112 genes are ranked by their selective essentiality in 21% vs. 1% O2. The two sides of the list are compiled independently by running MAGeCK analysis on 21% vs. 1% O2 and then in 1% vs. 21% O2. Red and blue color indicates genes selectively essential at 10% FDR. Bar plot vertical lines indicate position of genes in complex I or peroxisome biogenesis (PEX*) gene sets. (E) KEGG pathways that are selectively essential in 1% O2 (blue) or 21% O2 (red).
