
Figure 3. Mitochondrial genes are selectively essential at high oxygen levels.
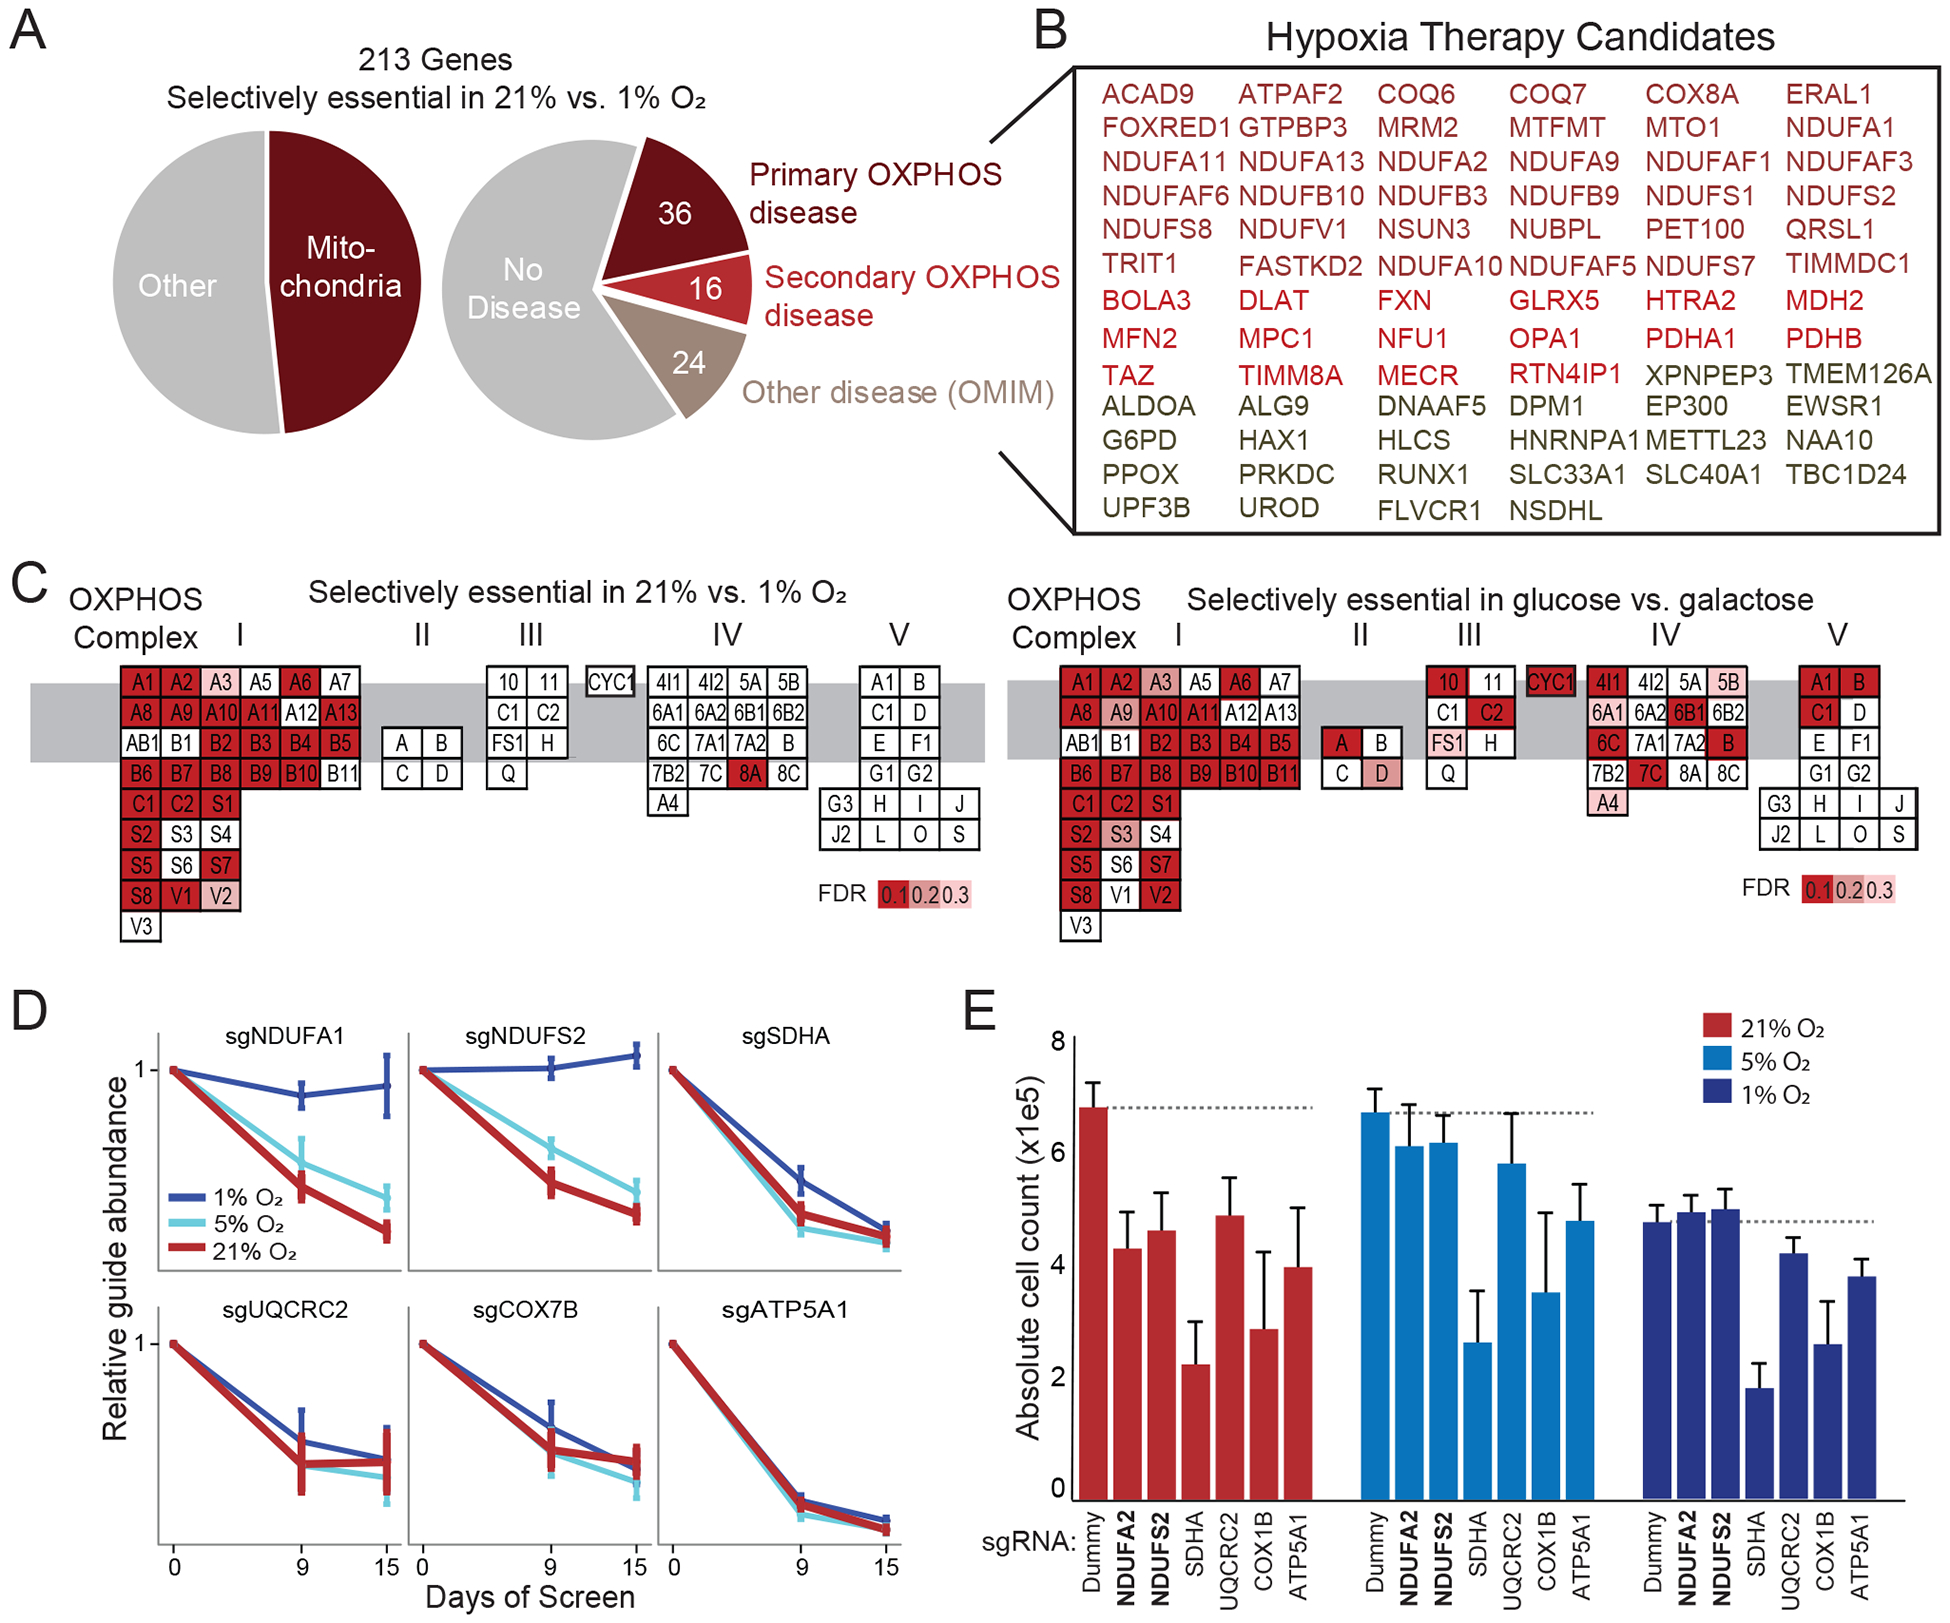
(A) Percentage of screening hits that encode mitochondrial proteins (left) or underlie human Mendelian disease (right) (Frazier et al., 2019; Hamosh et al., 2005). (B) Disease genes whose loss is buffered by hypoxia in cell culture. Different colors correspond to primary or secondary mitochondrial disease (Frazier et al., 2019), or non-mitochondrial diseases. (C) OXPHOS genes are organized by complex with red indicating genes that are hits in current screen (selectively essential in 21% vs. 1% O2, left panel) or in the glucose-galactose screen (unable to survive in galactose, right panel) (Arroyo et al., 2016). Genes are ordered alphabetically within complex using complex-specific prefixes (NDUF, SDH, UQCR, COX, ATP5) (e.g. A1 in CI refers to NDUFA1 whereas A in CII refers to SDHA). (D) sgRNA abundance at different time points of screen and oxygen tensions for CI-CV genes. Mean relative abundance (+/− SEM) shown across 4 guides per gene across all screen replicates. (E) Experimental validation in HEK293T knockout cell lines shows three-day growth as a function of oxygen tension (mean n=6 replicates +/− SD, Dummy indicates non-coding control). While all knockouts showed reduced growth compared to Dummy in 21% O2 and 5% O2, only complex I knockouts (bold text) show similar or increased growth in 1% O2.