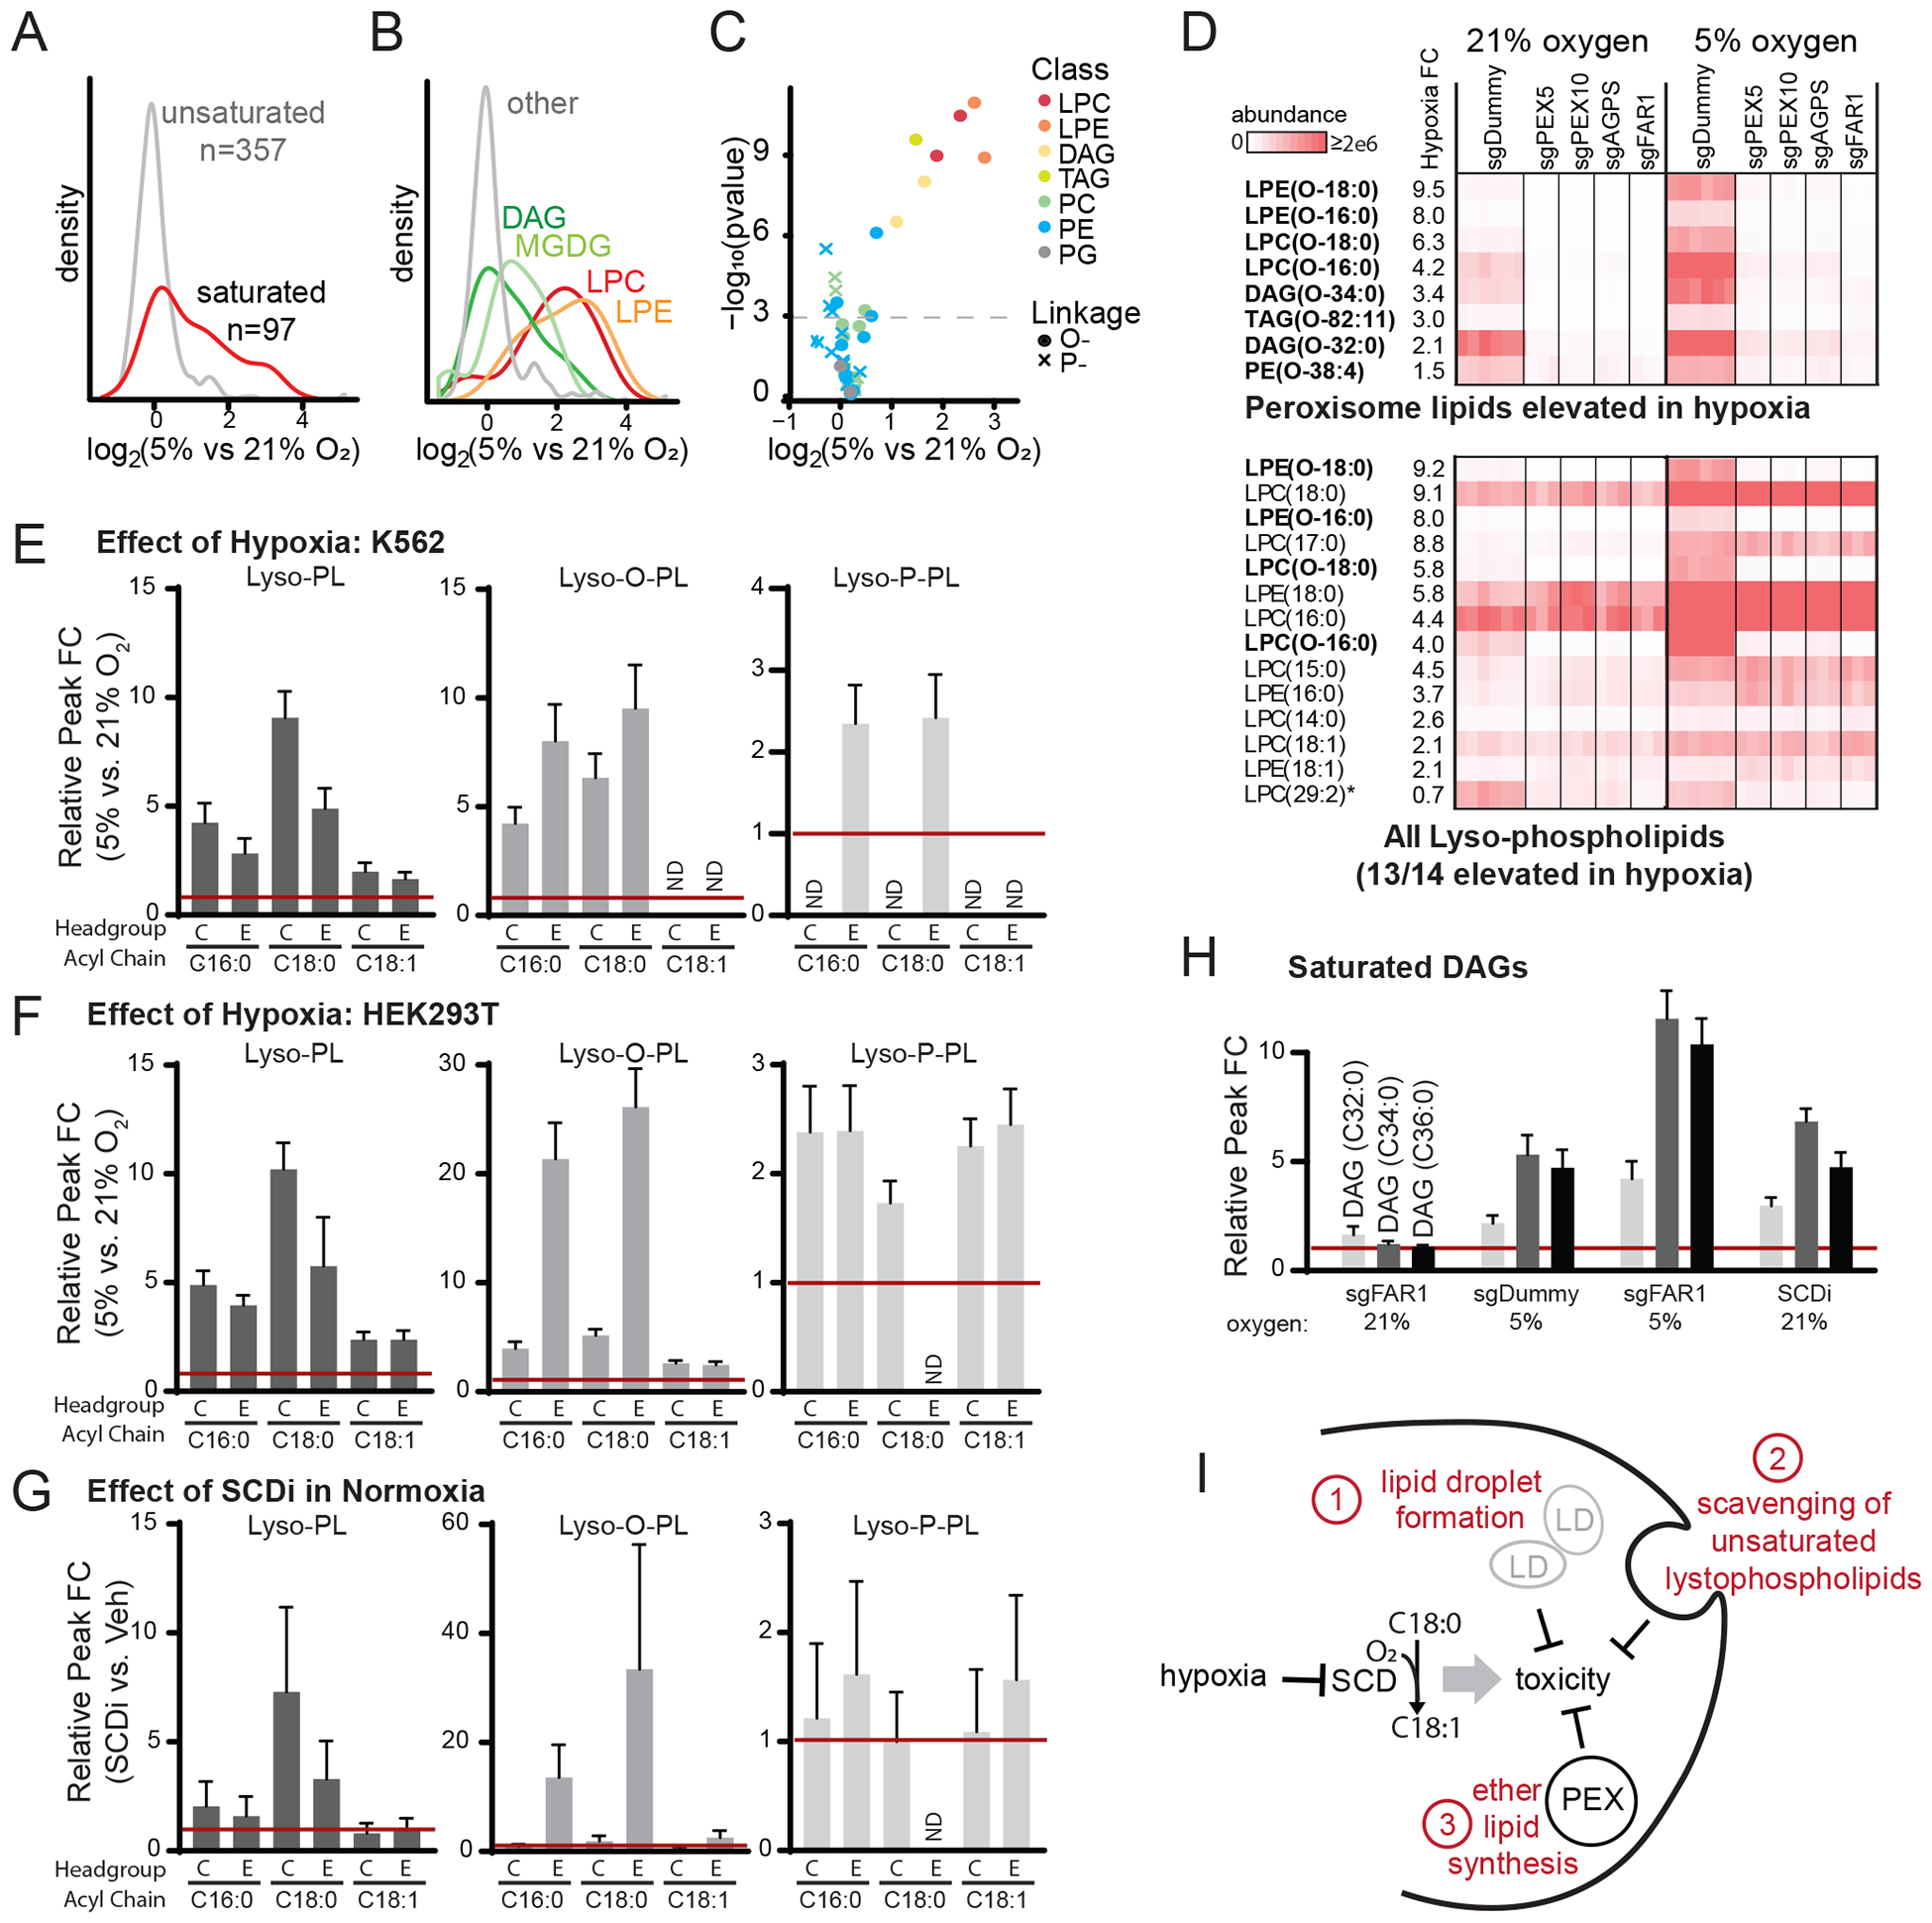
Figure 5: Peroxisomal lipids are synthesized in hypoxia.

(A) Density plot shows saturated lipid levels increased after 24 hr exposure to hypoxia (5% oxygen) in K562 control cells treated with sgDummy (non-coding control). (B) Density plot shows lipid classes that are increased during hypoxia in K562 control cells treated with sgDummy. (C) Volcano plot shows all confirmed peroxisome-derived lipids, where color indicates lipid class and shape indicates linkage (circle denotes ether, cross denotes vinyl-ether). (D) Heatmaps show all eight peroxisome-derived lipids that are significantly increased in hypoxia in K562 cells treated with sgDummy (non-coding control) (top) and all lyso-phospholipids (bottom). Heatmaps show relative lipid abundance in sgDummy and CRISPR knockout cell lines, with lipids ordered by fold change (FC) between mean of control cells in 5% vs. 21% oxygen. Bold indicates peroxisome-derived lipids and asterisk indicates lipid not elevated in hypoxia. (E-G) Fold change of selected lyso-phospholipid species in hypoxia (5% vs. 21%) in K562 cells (panel E) and HEK293T cells (panel F) and in HEK293T cells with SCDi treatment (SCDi vs. Veh, panel G). (H) Fold change of saturated DAG species in different conditions (compared to sgDummy at 21% O2) shows changes due to FAR1 knockout, hypoxia, and FAR1 knockout and hypoxia. (I) Schematic model shows hypoxia inhibits SCD which induces toxicity that can be abrogated by three known mechanisms: lipid droplet formation (Piccolis et al., 2019), lyso-phospholipid scavenging (Kamphorst et al., 2013), or peroxisomal ether lipid synthesis shown here.
