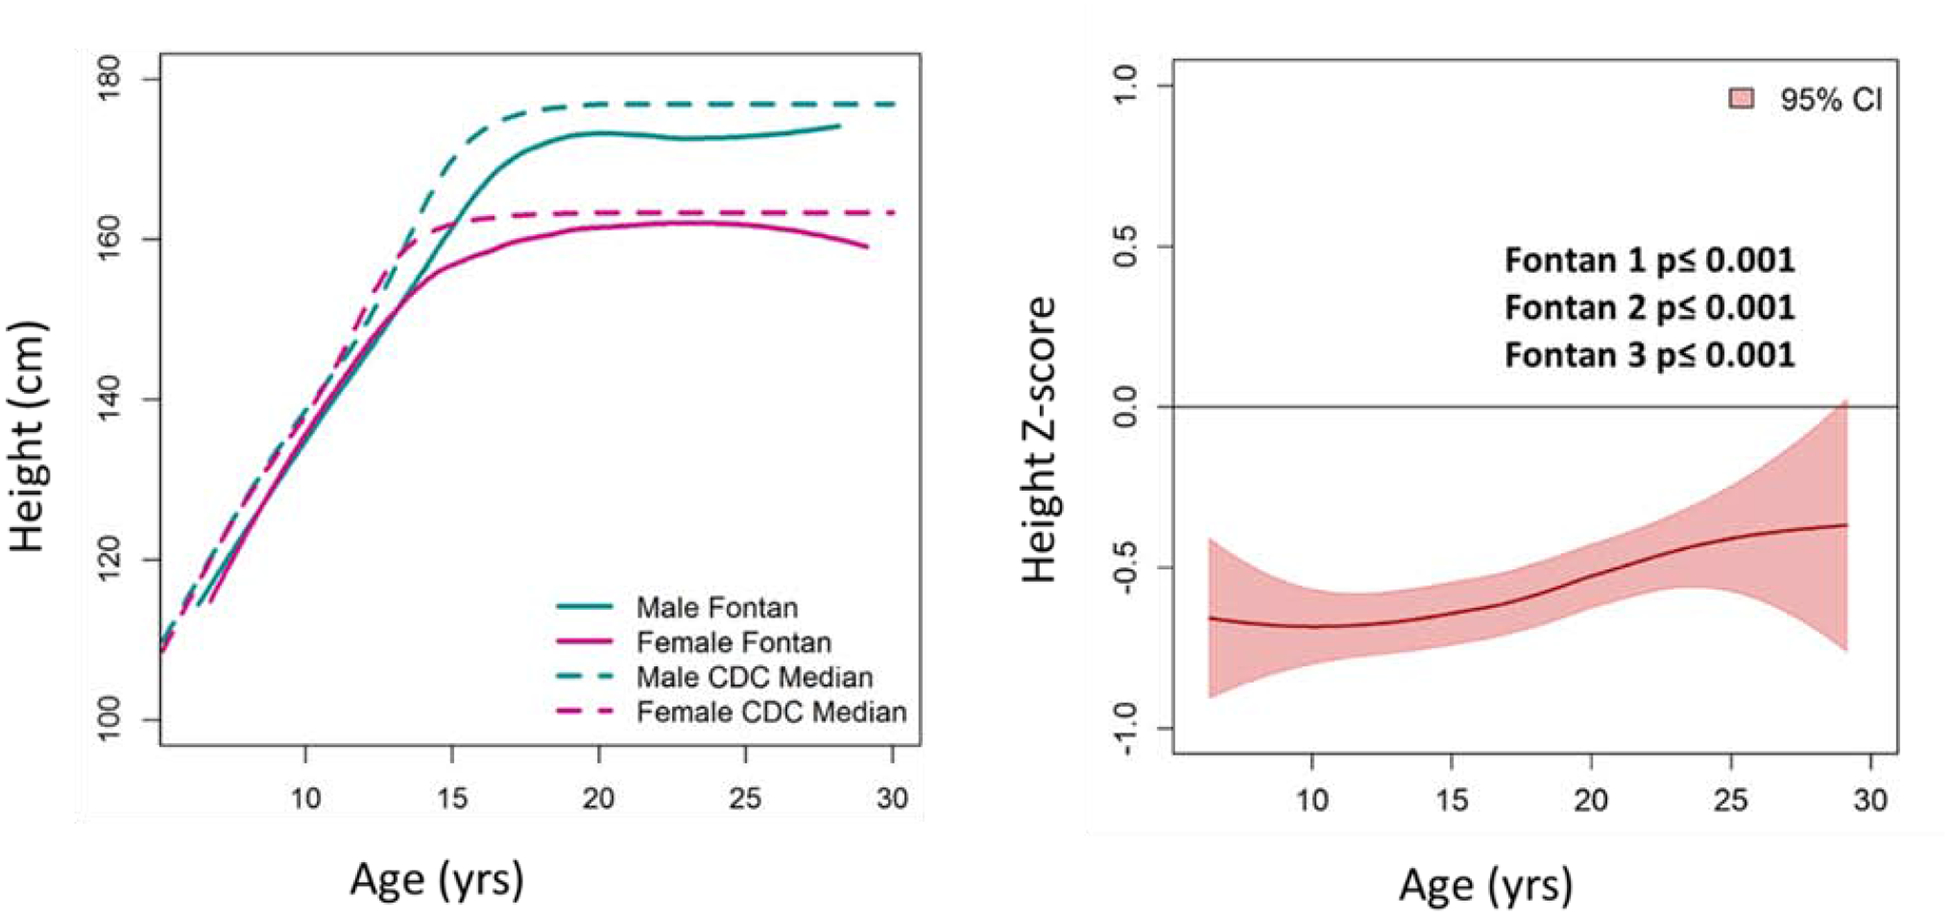
Figure 1:

Height Comparison of the Fontan Cohort with the Normal Population. (A) Heights of male and female Fontan participants were lower than CDC norms. (B) Average height z-score of the Fontan cohort was below normal (Z=0) across ages and study time-points.
BMI: The mean BMI z-score was −0.05±1.00, −0.059±1.26, and −0.15±1.27 for F1, F2 and F3, respectively. BMI z-scores for both male and female Fontan participants, age ≤ 20 years, were not significantly different from the normal population (Figure 2). In adult participants >20 years at F2 and F3, 41% (CI 34–48%) of the males and 33% (CI 26–41%) of the females were overweight or obese. The prevalence of overweight and obesity in adults, age > 20 years, in the study cohort was lower than the general US population (p<0.001) (Figure 3).
