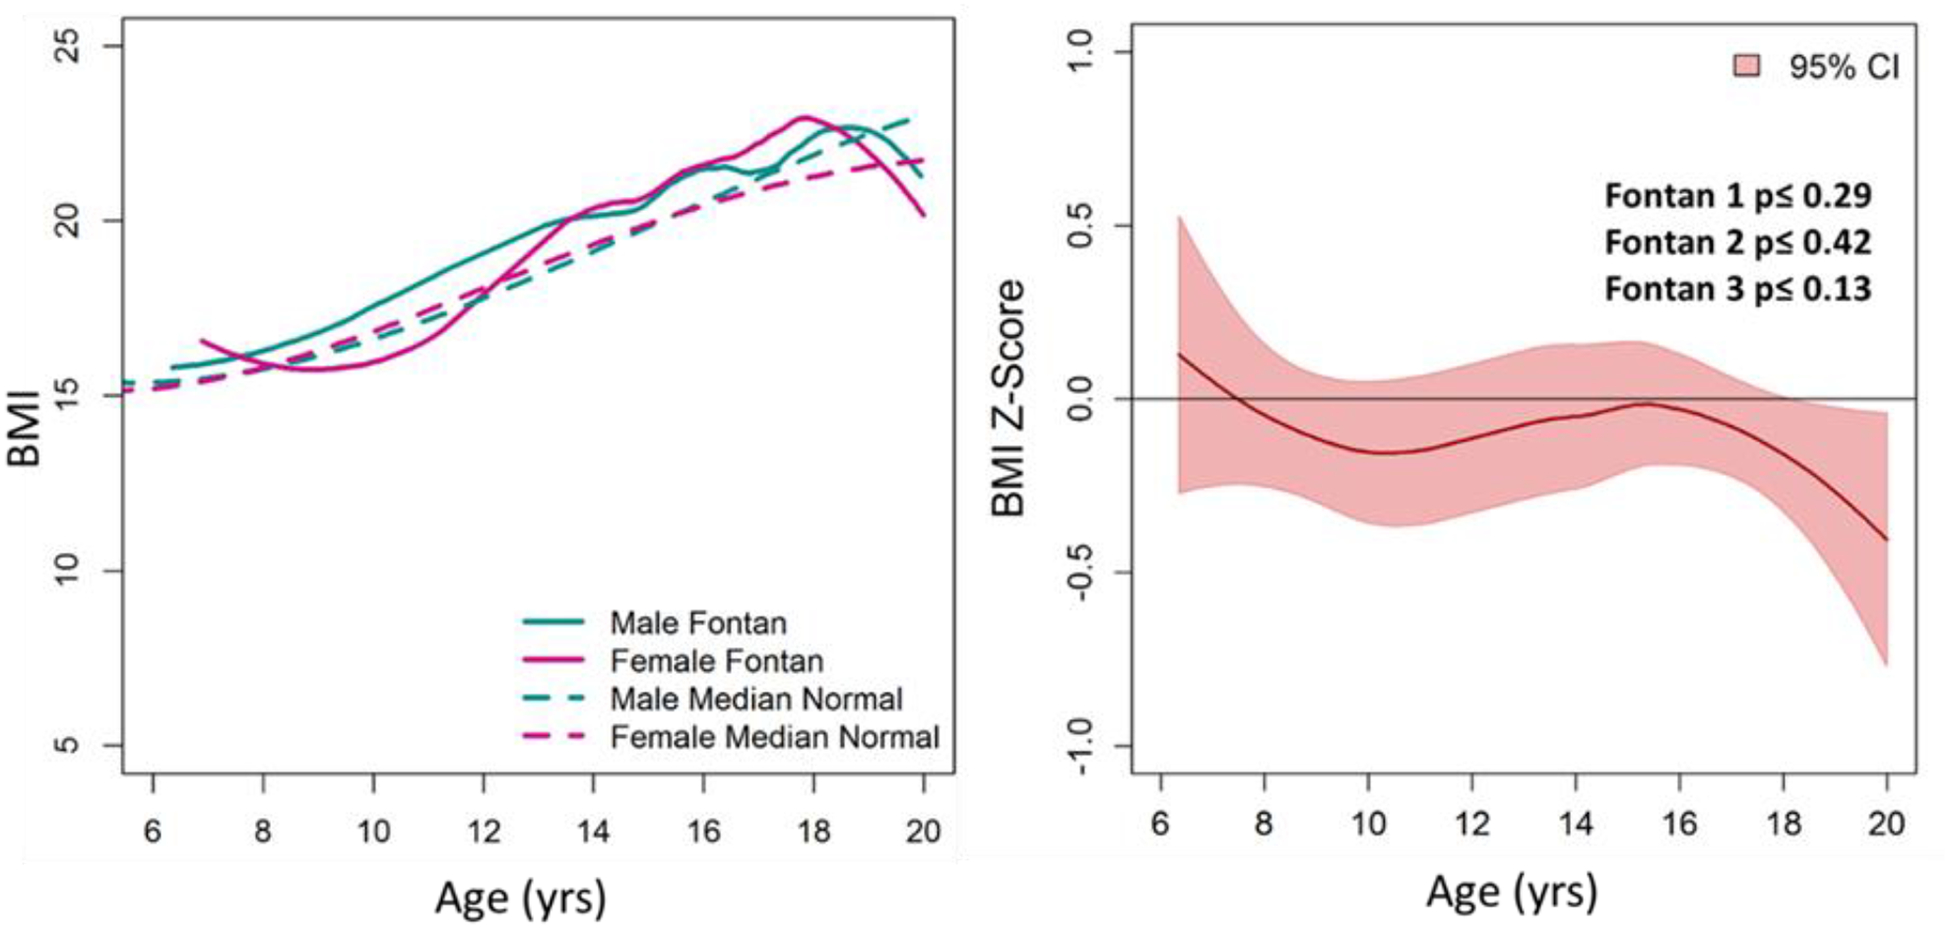
Figure 2:

BMI Comparison of the Fontan Cohort with the Normal Population. (A) BMI of male and female Fontan participants was similar to CDC norms. (B) Average BMI z-score (for age≤20 years) of the Fontan cohort was similar to normal (Z=0) across ages and study time-points.
