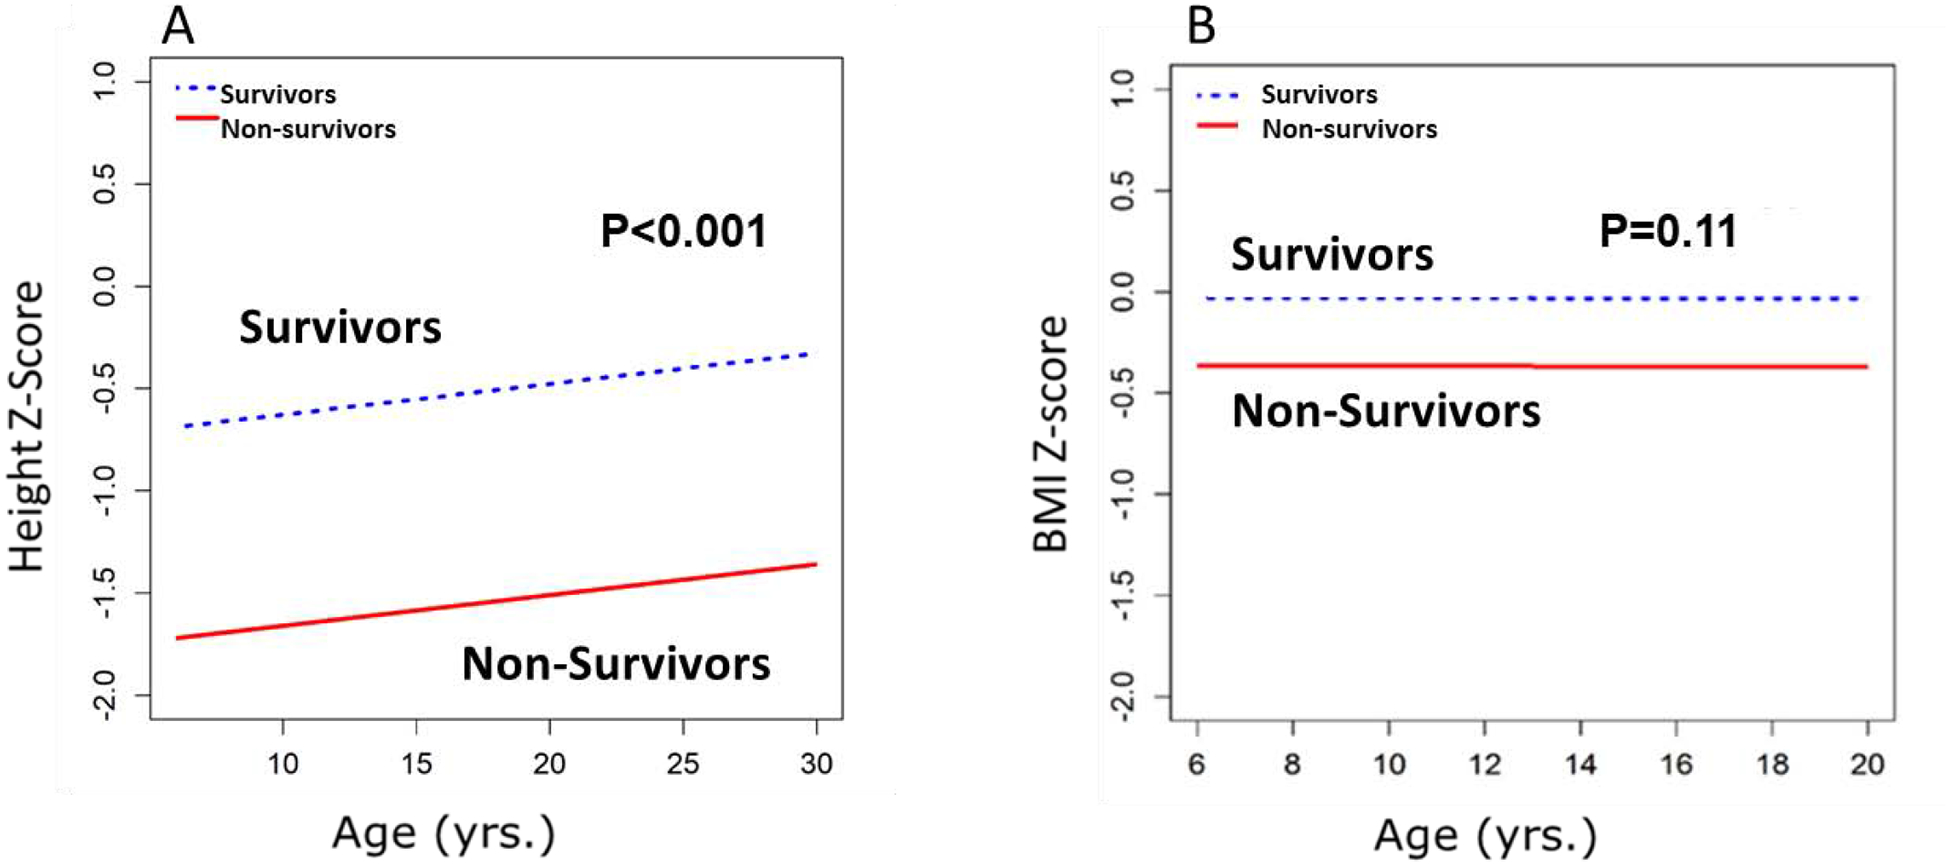
Figure 5A and 5B:

Comparisons of Height and BMI z-scores for Fontan Survivors vs. Non-survivors (N=32 non-survivors). Odds of death were lower with increasing height z-score: p<0.001; OR=0.56 [95% CI: 0.46, 0.68], but did not change with increasing BMI z-score: p=0.11; OR=0.82 [95% CI: 0.64, 1.05]. All 32 non-survivors had data on height and BMI at F1. Of the 16 deaths after F2, 14 participants had data on height and BMI, with 4 of these participants over age 20. Of the 6 deaths after F3, 5 participants had data on height and BMI at F3; all of them were over age 20.
