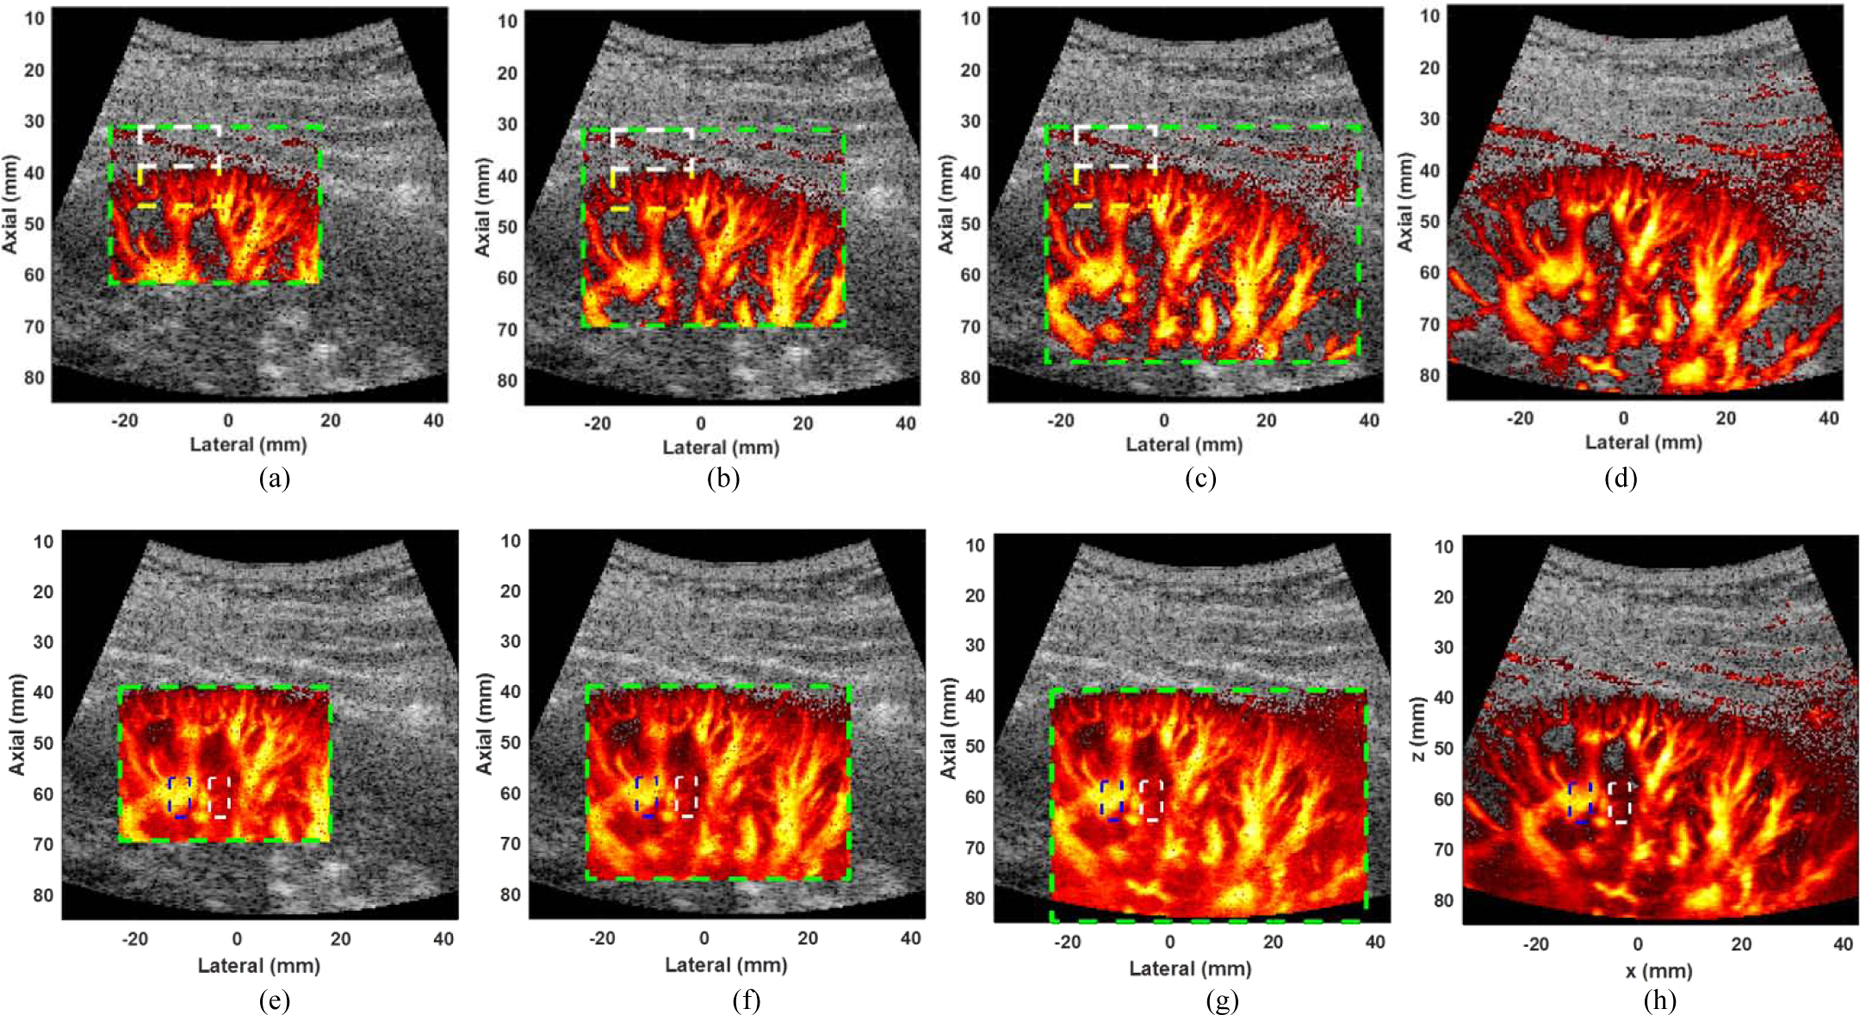
Fig. 8.

Power Doppler of kidney images with noise reduction using block size of (a) 20×20, (b) 25×25, and (c) 30×30, and (d) SVD with full frame. The green dashed box represents the ROI of the power Doppler image. The white (representing tissue) and yellow (representing blood) dashed boxes indicate the regions used to evaluate the blood-to-clutter ratio. Power Doppler of kidney images without noise reduction using block size of (e) 20×20, (f) 25×25, and (g) 30×30, and (g) SVD with full frame. The white (representing noise) and blue (representing blood) dashed boxes indicate the regions used to evaluate the signal-to-noise ratio. The dynamic range of power Doppler images was set as 0–50 dB for all images. The ensemble size, PCFR and rank of tissue clutter subspace were set as 45, 1 kHz, and 15, respectively. The dynamic ranges of B mode and power Doppler images were set as 50 dB for all images. The minimum and the maximum dynamic range values of dual-mode images were set as −50 dB and 0 dB, respectively.
