
Figure. 2.
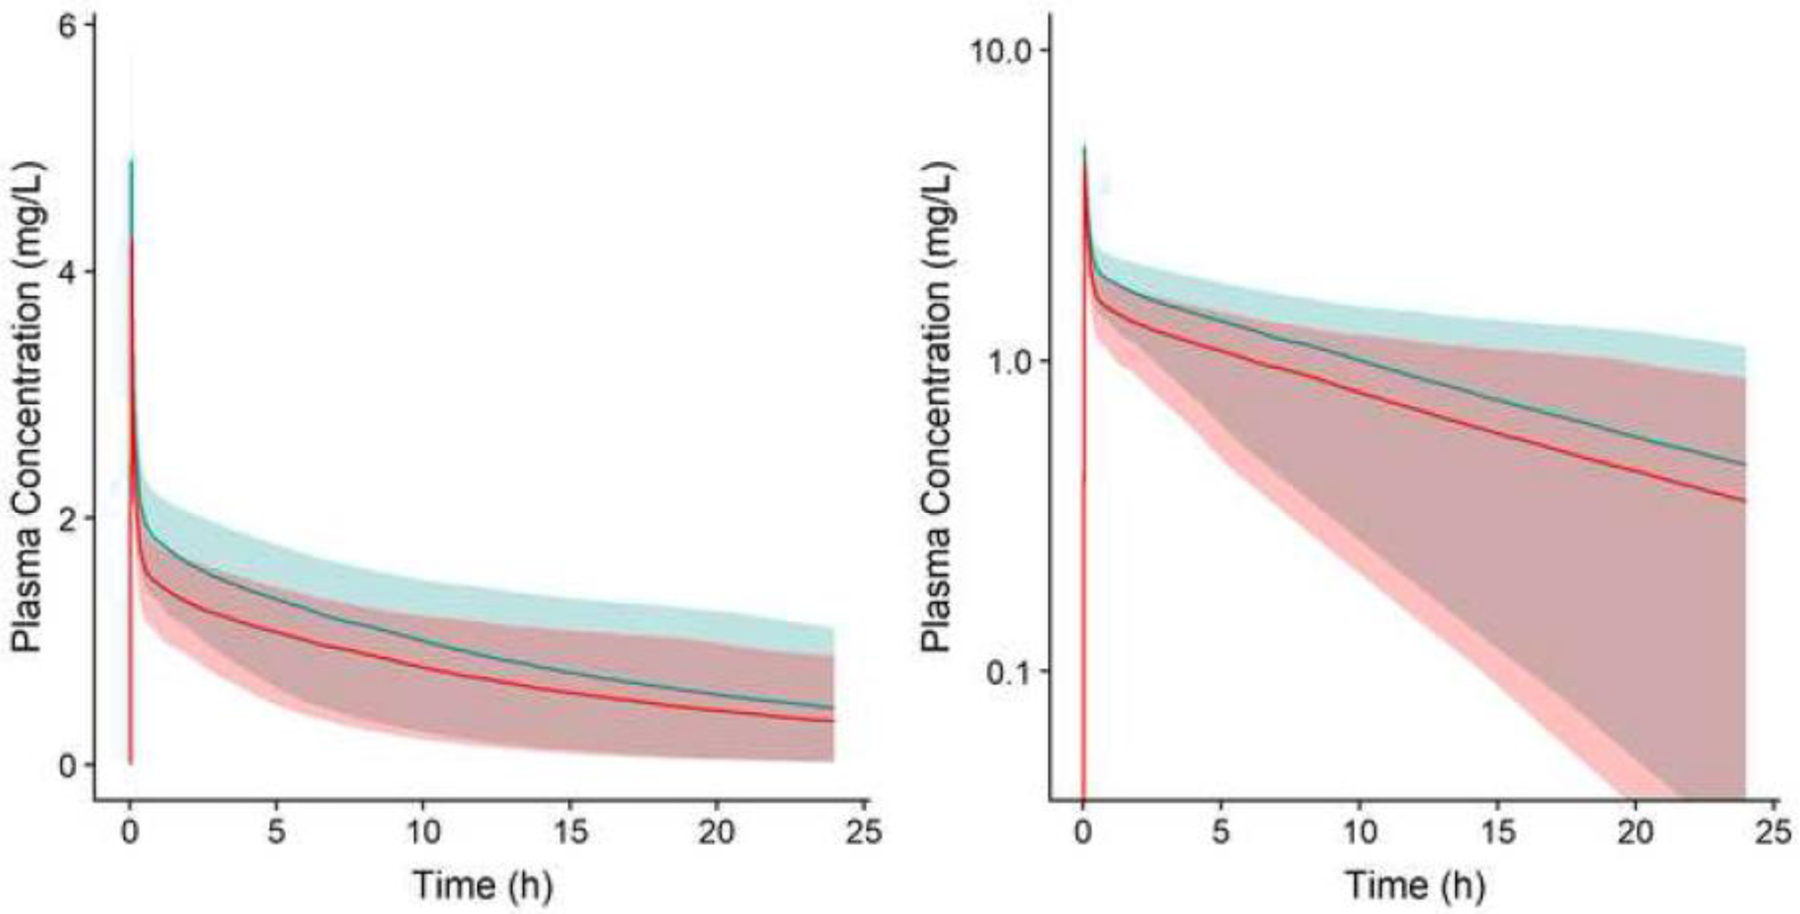
Simulated plasma concentration-time profiles (linear, A; semi-logarithmic, B) for two theoretical hepatic isozyme CYP3A4 substrates with different fractions unbound in plasma [0.10 (blue) and 0.13 (red)]. Shaded regions depict 90% PI for Pop-PBPK model simulations following administration of 1.5 mg/kg IV doses of each theoretical compound to a population of 100 virtual neonates. Solid lines depict median concentration-time values.
IV, intravenous; PI, prediction interval; Pop-PBPK, population physiologically-based pharmacokinetic