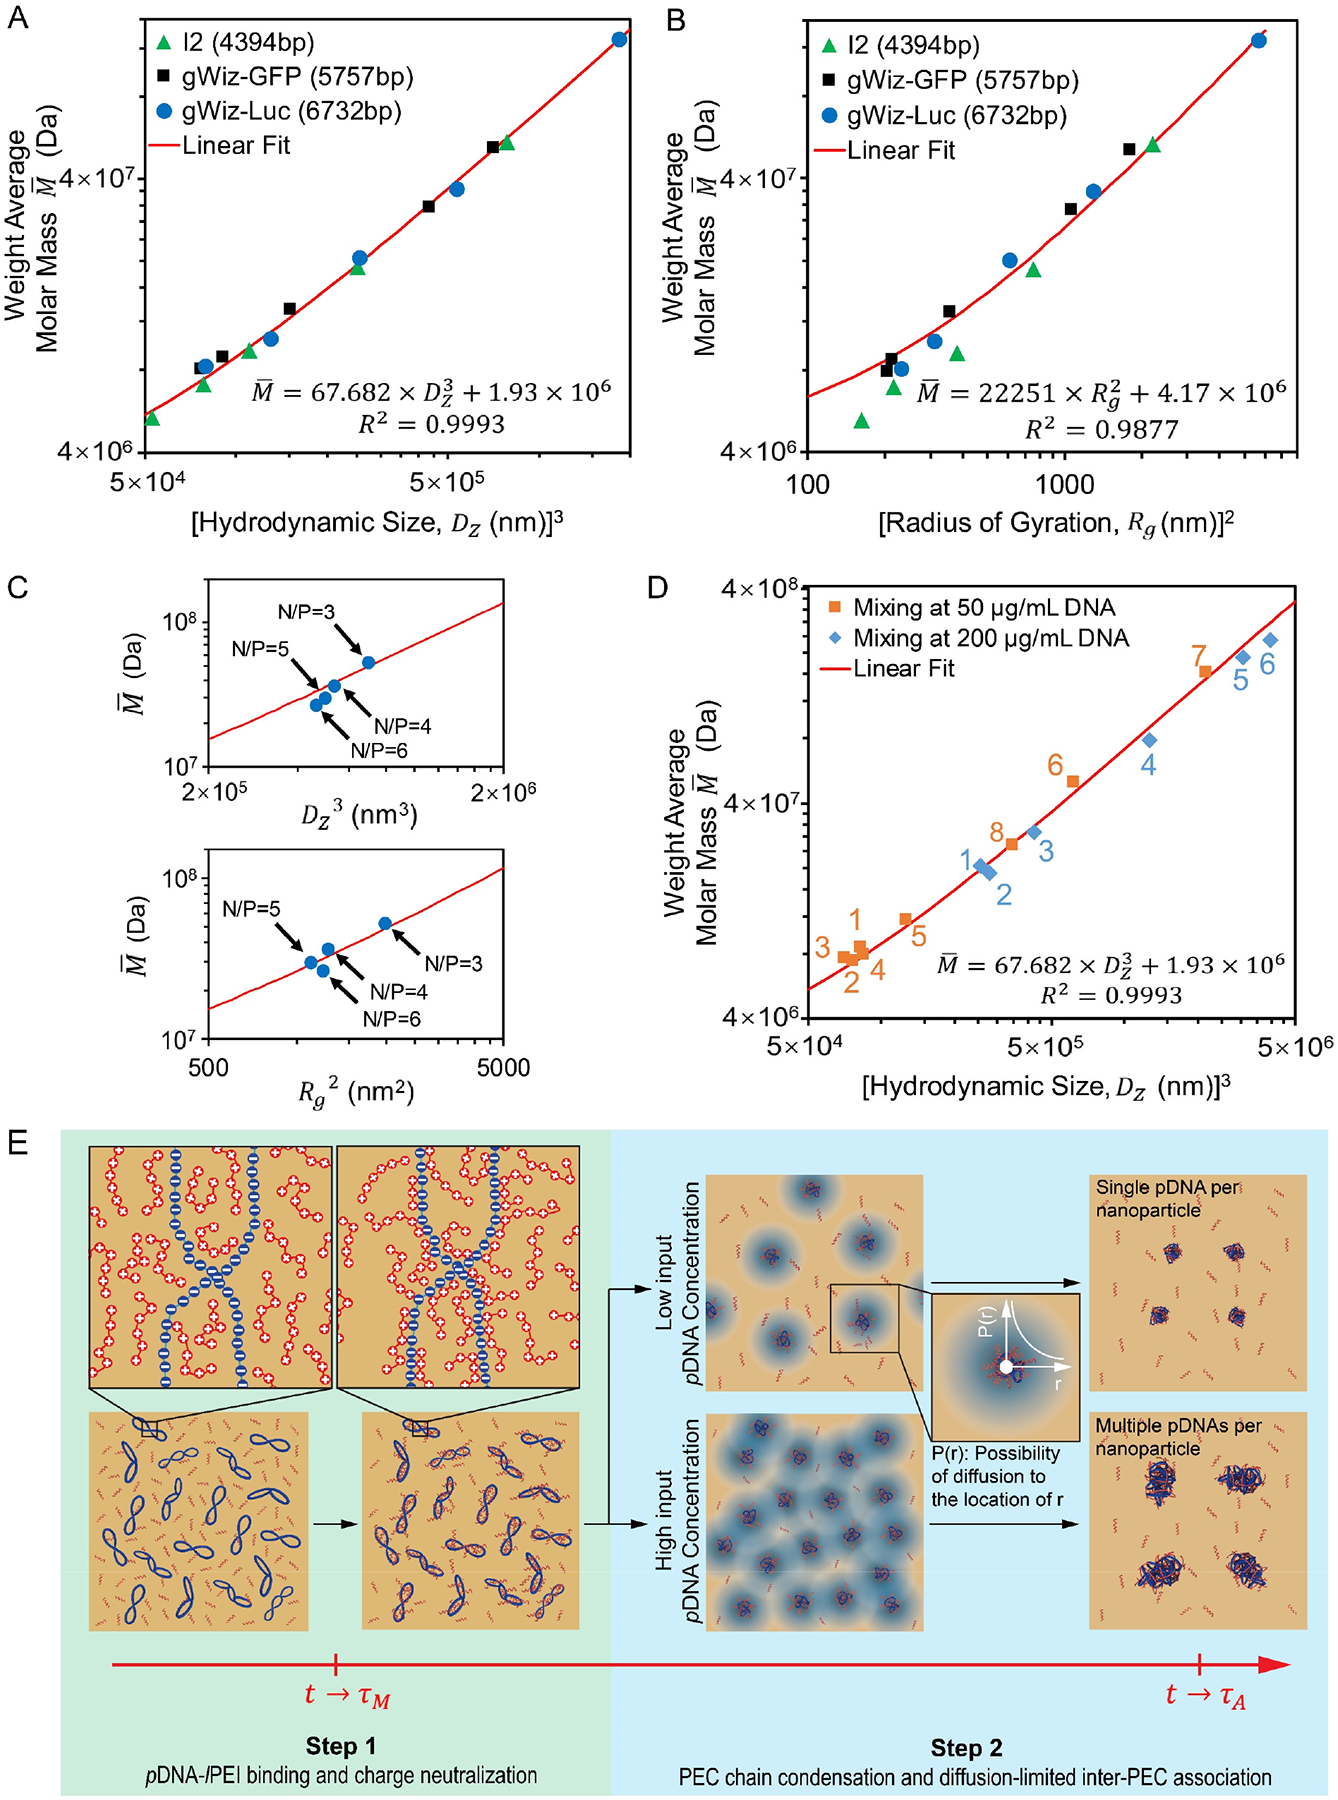
Figure 4. Assembly of pDNA/lPEI PEC nanoparticles.

(A, B) Correlation of nanoparticle average molar mass and size (A) and radius of gyration (B) for nanoparticles assembled under turbulent mixing condition (Q = 20 mL/min, τM = 15 ms). Each data point in (A) and (B) represents an independent formulation batch; (C) Application of the linear fits from Eq. 5 (Upper panel) and Eq. 6 (Bottom panel) to nanoparticles formulated with different N/P ratios at Q = 20 mL/min; (D) Correlation of nanoparticle average molar mass and size for nanoparticles produced by different mixing conditions, i.e. with different τM. For input pDNA concentration of 25 μg/mL (orange), label 1 to 8 represent τM of 7, 11, 15, 23, 163, 5855, 4 × 10⁵ ms, and pipetting respectively; for 100 μg/mL (blue), label 1 to 6 represent τM of 8, 15, 42, 795, 104 and 2 × 10⁵ ms, respectively; (E) The proposed two-step pDNA/lPEI PEC nanoparticle assembly model under turbulent mixing condition (τM < τA).
