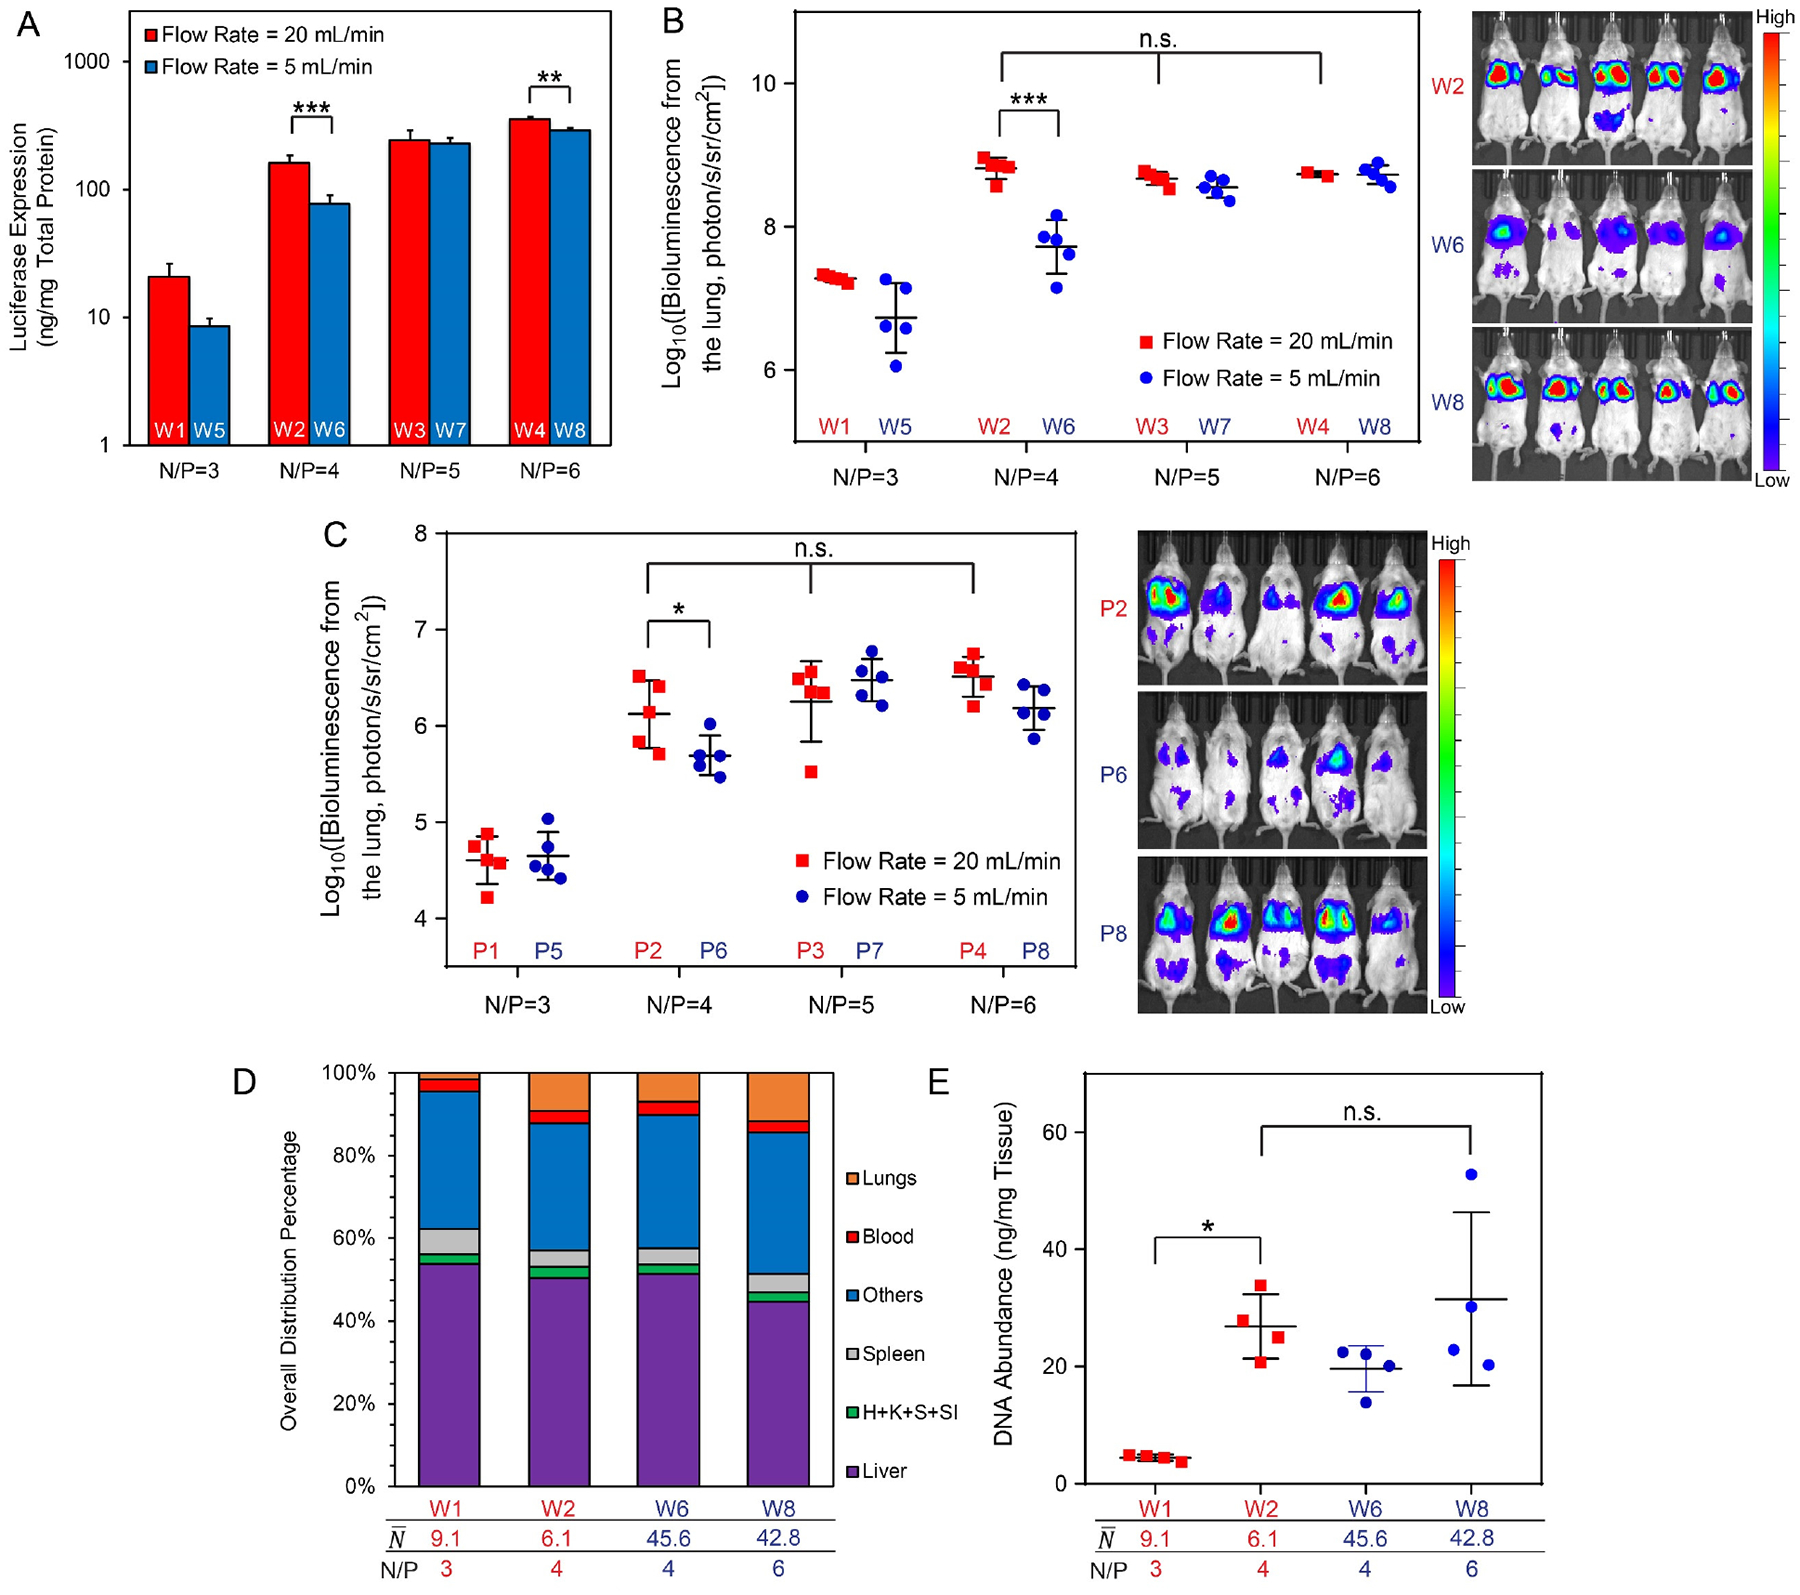
Figure 6. Transgene expression of pDNA/lPEI nanoparticles produced under kinetically controlled conditions with different N/P ratios and payload levels ().

(A) In vitro transfection efficiencies of nanoparticles (W1–W8, see Table 1) in PC3 cancer cell line (dose = 0.6 μg gWiz-Luc plasmid/104 cells); (B) In vivo transfection efficiency in the lung in healthy BALB/c mice at 12 h post i.v. injection of nanoparticles (W1–W8, see Table 1) containing 40 μg gWiz-Luc plasmid per mouse (left) and representative IVIS images of groups with significant differences in transgene expression (right); (C) In vivo transfection efficiency in the lung of an LL/2 metastasis model in the NSG mice at 48 h post injection of nanoparticles (P1-P8, see Table 1) containing 40 μg PEG-Luc plasmid per mouse (left) and representative IVIS images of groups with significant differences in transgene expression (right); (D) Whole-body biodistributions in BALB/c mice at 1 h post injection of nanoparticles (W1, W2, W6, W8) containing 40 μg 3H-labeled gWiz-Luc plasmid per mouse. Labels: H: heart, K: kidneys, S: stomach, SI: small intestine; (E) Biodistributions to the lung of mice shown in (D); For statistical analysis, n.s. denotes no statistical significance with p > 0.05, *p < 0.05, **p < 0.01, and ***p < 0.001 from one-way or two-way ANOVA and multiple comparisons.
