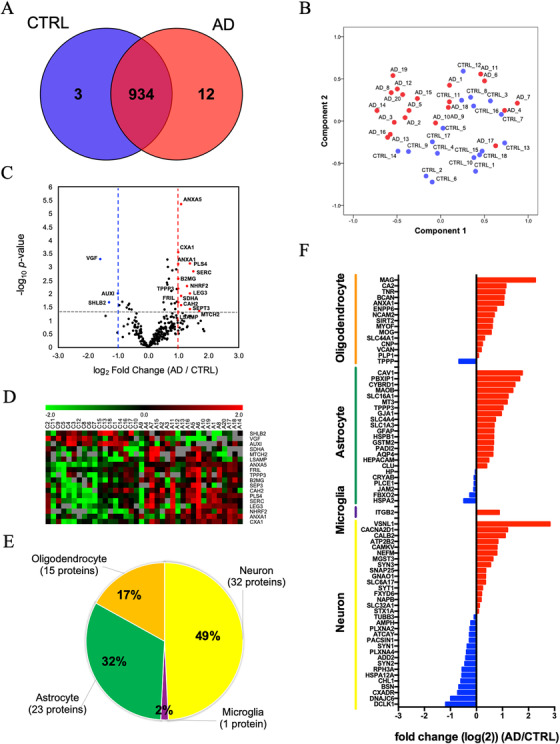
FIGURE 3.

Label‐free quantitative proteomics comparison of Alzheimer's disease (AD) brain‐derived extracellular vesicles (EVs) and control (CTRL) brain‐derived EVs: A, Venn diagram representing the number of EV proteins differentially expressed in CTRL and AD. B, A principal component analysis (PCA). CTRL; blue symbols, AD; red symbols. C, Volcano plot showing a degree of differential expression of EV proteins in AD compared with CTRL. X‐axis; log transformed fold change in expression, y‐axis; log‐transformed P‐values. Gray dot lines: 0.1 P‐value and 1‐ or ‐1‐fold change cutoff. D, Heat map representation of the up‐ and downregulated proteins in AD. Red shows upregulated proteins, and green shows downregulated proteins. E, Enrichment of brain cell type–specific markers in brain‐derived EV proteins. Yellow: Neuron, purple: microglia, green: astrocytes, orange: oligodendrocytes. The parentheses show the number and percentage of identified cell type‐specific protein. F, Comparison of the cell type–specific protein in AD brain‐derived EV and CTRL EV. The red bar shows higher expression in AD. Blue bar indicates higher expression in CTRL
