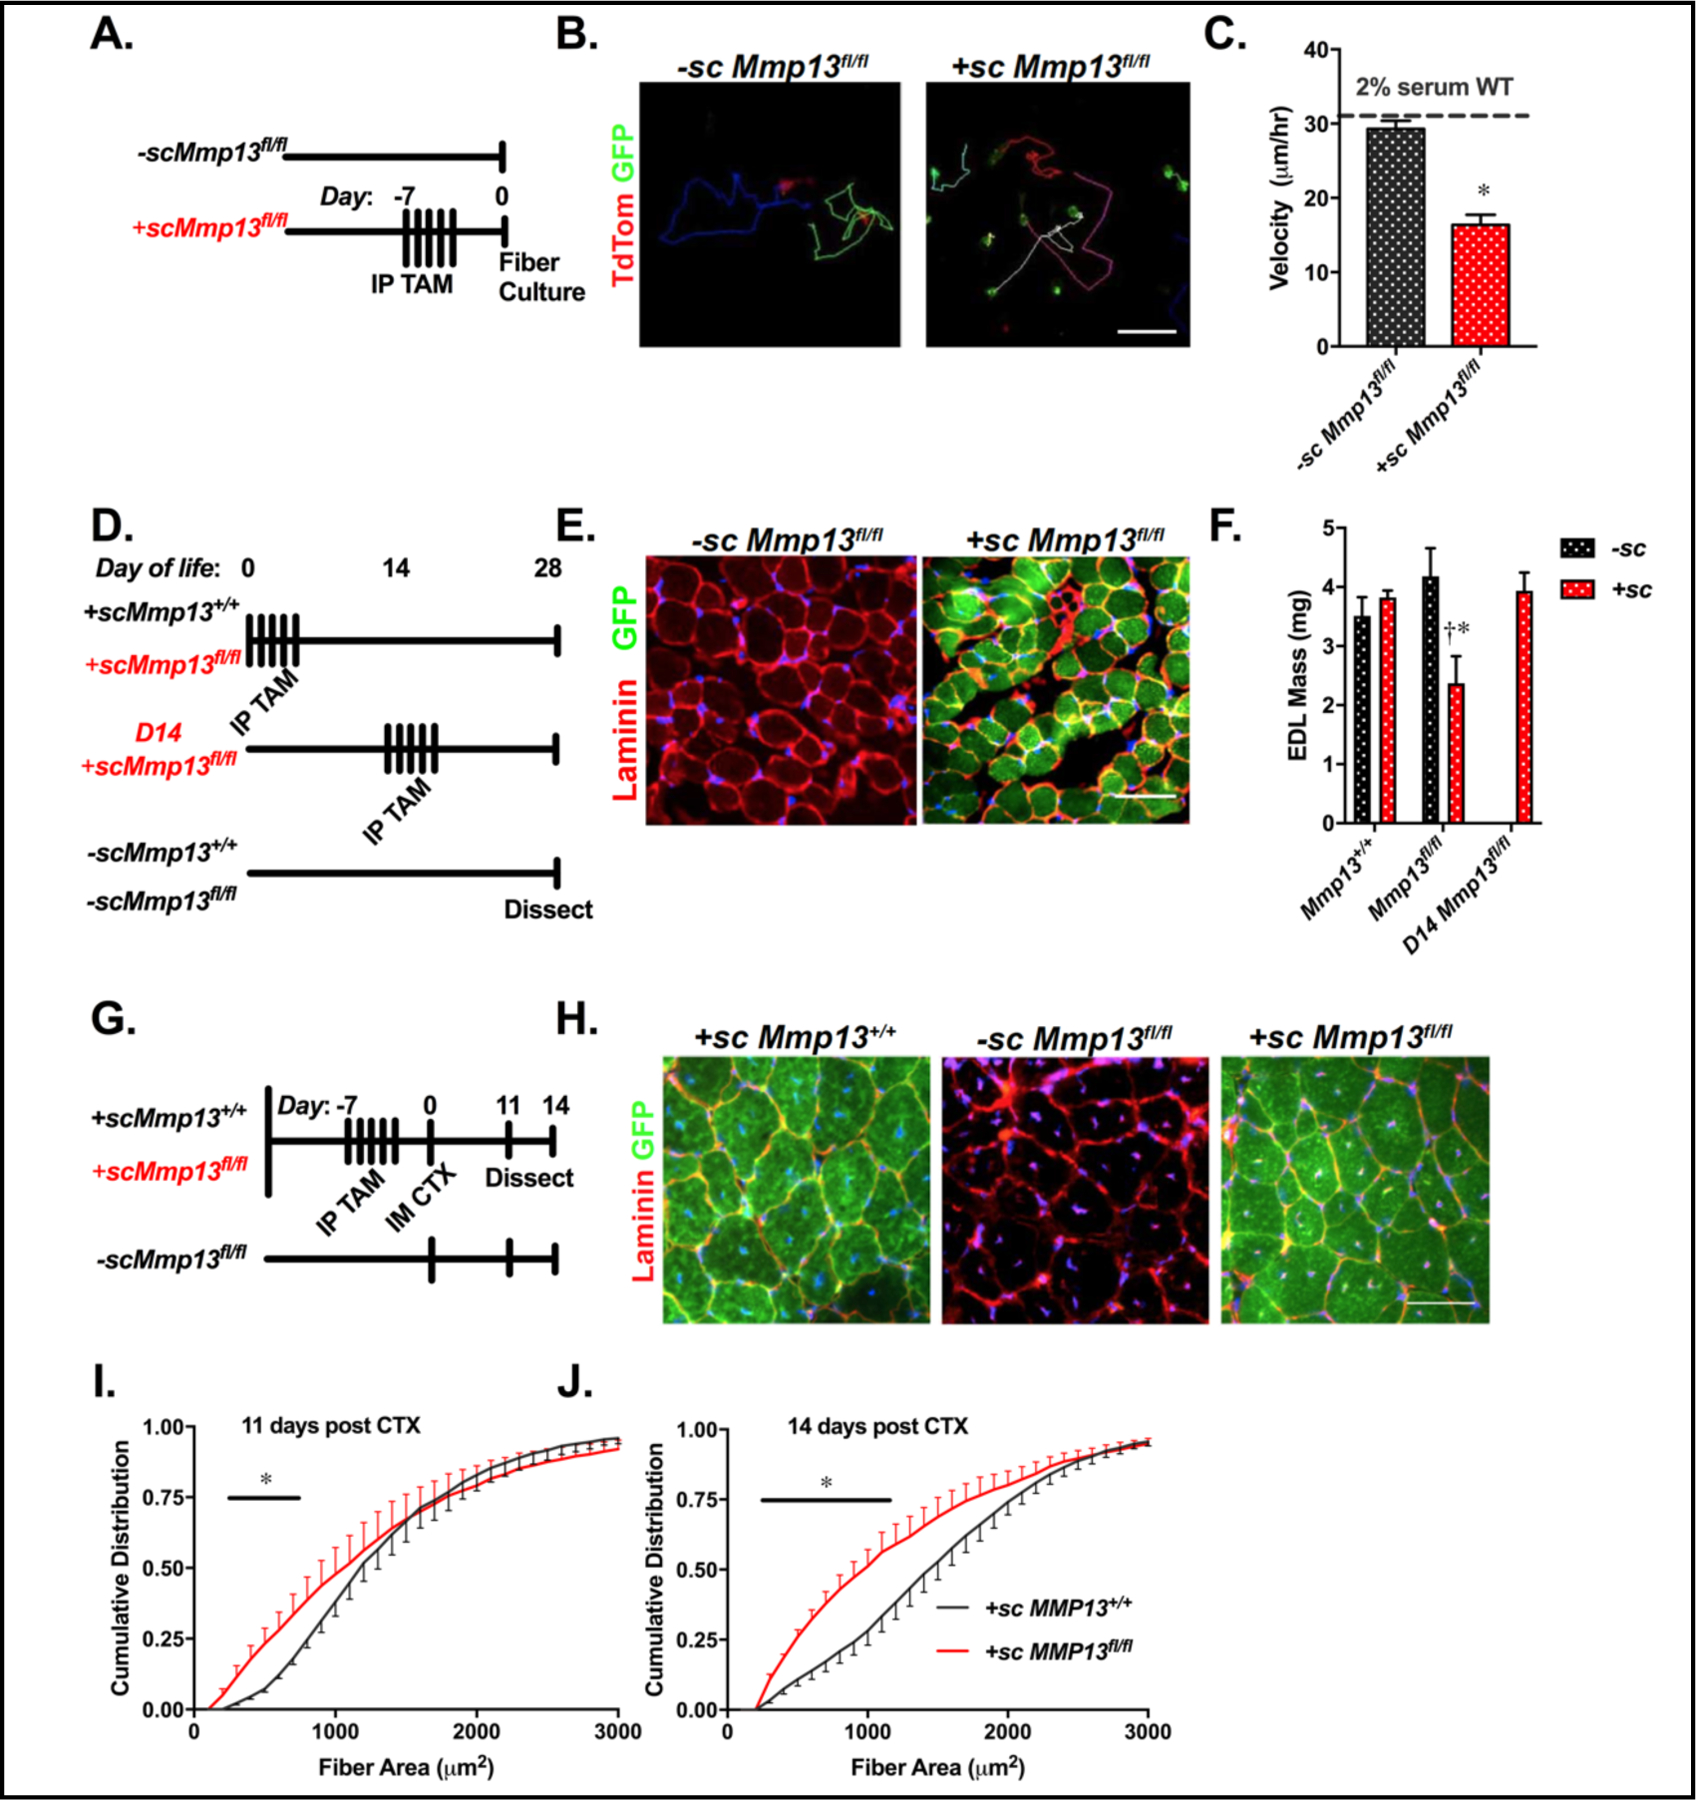
Fig. 5.

Satellite cell expression of MMP-13 underlies the Mmp13−/− phenotype. (A) Adult mice with Mmp13fl/fl Pax7CreER mT/mG received intraperitoneal injections of tamoxifen (TAM) (+sc) or corn oil (−sc) for 5 consecutive days 1 week prior to tissue harvest for single fiber culture. (B) A frame of live cell microscopy with multicolored fiber tracks showing the course of migration over 14 hours of cells from −sc/+scMmp13fl/fl mice (Sup Videos Overlay_RG-Control.avi and Overlay_RG-ko.avi). The +sc cells express GFP in satellite cells due to recombination of the mT/mG reporter element that expresses TdTomato in −sc cells. Scale bar = 100 μm. Representative videos are included in the supplement. (C) There is a significant reduction in migration velocity of +sc cells (N=114) that lack MMP-13 compared to −sc cells (N=103) expressing MMP-13 at 2% serum. In 20% serum +sc cells (N=73) do not exhibit impaired migration. (D) Similar schematic to (A), with TAM injections beginning on Day 1 or 14 of life, and mice being dissected at day 28 of life. (E) Examples of +sc/−scMmp13fl/fl TA muscles stained with laminin and expressing GFP indicating derivation from Pax7 cells recombined to ablate Mmp13. Scale bar 50 μm. (F) Muscle mass is significantly reduced in EDLs from +sc (N=5) compared to −scMmp13fl/fl (N=7) EDL muscles when TAM treatment occurred at Days 0–4. EDL mass was not reduced when TAM treatment occurred starting at Day 14 (N=3). In scMmp13+/+ mice, TAM treatment starting at Day 0 did not alter EDL mass (N=3 −sc, and N=4 +sc). (G) Similar schematic as (A) except at day 0 adult mice are injected with CTX and dissected at day 11 and day 14 of regeneration. Additionally, a mouse with Mmp13+/+ Pax7CreER mT/mG (+scMmp13+/+) was used as a further control for TAM injection. (H) Examples of +sc/−scMmp13fl/fl and +scMmp13+/+ TA muscles stained with laminin and expressing GFP indicating derivation from Pax7 cells recombined to express GFP from 14 days post CTX injection. Scale bar 50 μm. The cumulative distributions from (I) 11 days (Mmp13+/+ N=6;Mmp13fl/fl N=6) and (J) 14 days (Mmp13+/+ N=7;Mmp13fl/fl N=3) following CTX injections show significantly smaller fibers in +scMmp13fl/fl compared to +scMmp13+/+ muscles, similar to global Mmp13−/−. The * represents a significant (p<0.05) difference between satellite cells which express and do not express MMP-13, with the bar representing the range of fiber areas that have a significant difference in the cumulative distribution. The † represents a significant difference between each genotype with TAM treatment.
