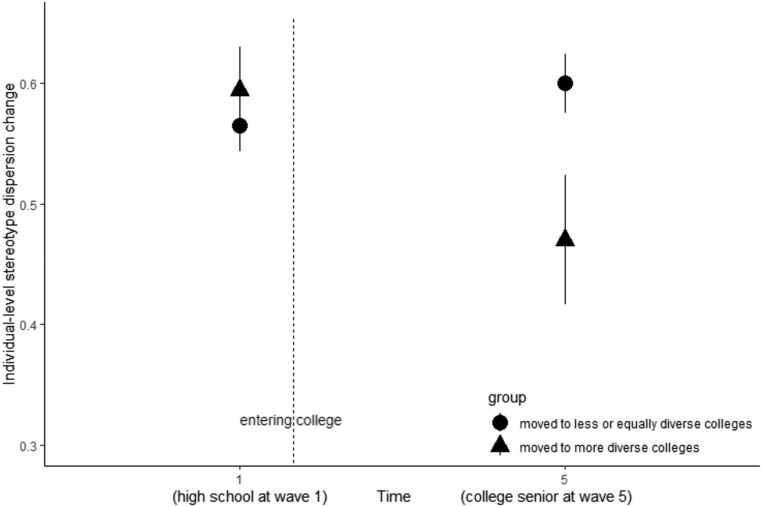
Fig. 4.
Students who attended more diverse colleges show larger decrease in stereotype dispersion from high school to college. Note that analysis unit is American college student, at two time points, n = 3,924. The x axis indicates two time points: end of high school and end of college. The y axis indicates stereotype dispersion change, from less increase to more increase. Error bars in circle represent students who experienced less diversity changes from high school to college, while error bars in triangle represent students who experienced more diversity changes. As shown, students who experienced more diversity changes decreased dramatically in stereotype dispersion, compared to the other group. See statistics in Results.

