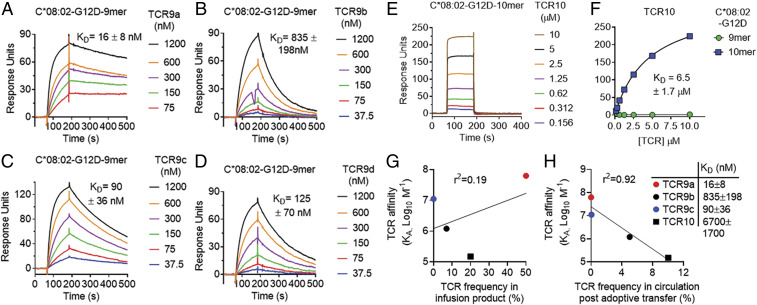
Fig. 3.
KRAS-G12D–specific TCRs display high affinities that inversely correlate with in vivo persistence. (A–D) Binding of TCR9a (A), 9b (B), 9c (C), and 9d (D) to captured HLA-C*08:02–KRAS-G12D-9-mer at the indicated nanomolar concentrations determined by surface plasmon resonance. Dissociation constants were determined by kinetic curve fitting. Data are representative of two independent experiments. (E) Binding of TCR10 to captured HLA-C*08:02–KRAS-G12D-10-mer at the indicated micromolar concentrations determined by SPR. Data are representative of three independent experiments. (F) Equilibrium binding and affinity (steady state) of TCR10 to HLA-C*08:02–KRAS-G12D-10-mer and KRAS-G12D-9-mer. Data are representative of three independent experiments. (G and H) Correlation of TCR affinity (KA) with TCR frequency in the infusion product used to treat patient 4095 (G) and in the periphery of patient 4095, 9 mo after T cell transfer (H). TCR frequencies are from ref. 17.

