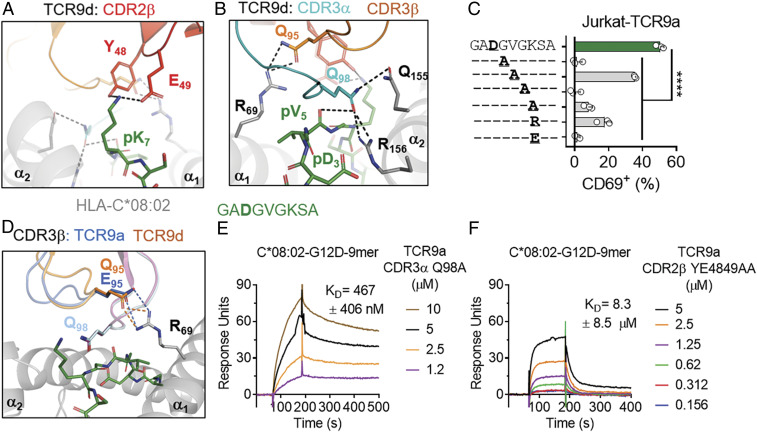
Fig. 5.
T cell recognition of the KRAS-G12D nonamer via CDR2β. (A) TCR9d CDR2β interactions with p7 Lys of the KRAS-G12D-9-mer. CDR2β, red; HLA-C, gray; KRAS-G12D-9-mer, green. (B) TCR9d CDR3α interactions with HLA-C*08:02 and the KRAS-G12D-9-mer. CDR3α, turquoise; CDR3β, orange; HLA-C, gray; KRAS-G12D-9-mer, green.(C) Frequency of TCR+ Jurkat T cells expressing CD69 after incubation with 221-C*08:02-ICP47 cells loaded with KRAS-G12D-9-mer peptides with the indicated amino acid substitutions. Amino acids identical to the KRAS sequence are indicated with “–.” Peptides were tested from 1,000 to 1 nM, shown here at 10 nM; data are a mean of three independent experiments. Statistical significance was assessed by one-way ANOVA with Dunnett’s multiple comparison test (****P < 0.0001). (D) TCR9a/d CDR3β interactions with HLA-C*08:02 Arg-69. TCR9a-CDR3β, blue; TCR9d-CDR3β, orange; HLA-C, gray; KRAS-G12D-9-mer, green. (E and F) Binding of TCR9a-CDR3α Q98A (E) and TCR9a-CDR2β YE48,49AA (F) to captured HLA-C*08:02–KRAS-G12D-9-mer at the indicated nanomolar concentrations determined by SPR. Dissociation constants were determined by kinetic curve fitting. Data are representative of two independent experiments.

