Fig. 1.
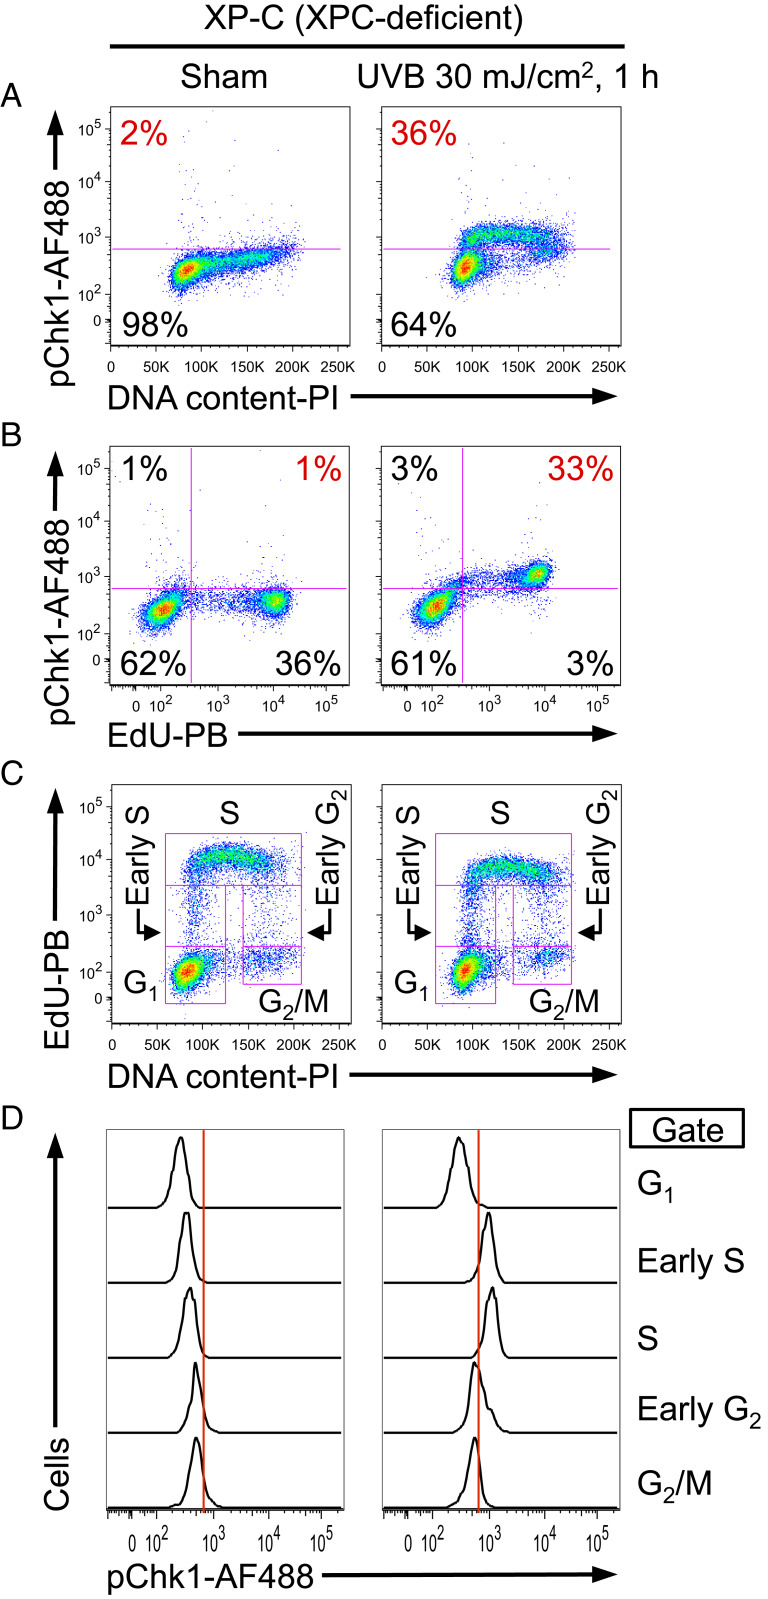
UV-induced phosphorylation of Chk1 is strictly limited to S phase as revealed by flow cytometry. (A–D) XP-C cells (GM15983) were pulse labeled with EdU for 1 h, followed by sham (Left) or UVB irradiation (Right), and harvested 1 h after irradiation. (A) Phosphorylation of Chk1 at Ser345 (pChk1) was evaluated as a function of DNA content. The percentage of pChk1(+) cells is shown in red. (B) UV-induced pChk1 strongly correlates with EdU incorporation. The percentage of EdU(+)pChk1(+) cells is shown in red. (C) EdU incorporation and DNA content were used to identify five cell cycle subpopulations (G1, early S, S, early G2, and G2/M phases; pink boxes identify gates used). (D) pChk1 was evaluated for the cell cycle subpopulations defined in C. Chk1 phosphorylation was essentially restricted to UV-irradiated cells that were in early S or S phase. Data from one representative experiment of three independent experiments are shown.

