Fig. 3.
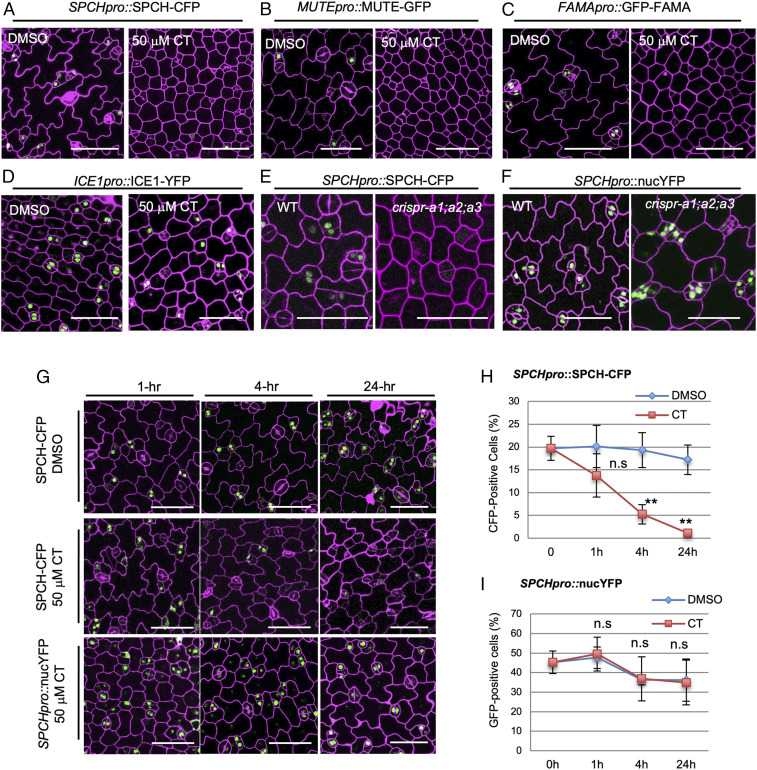
PP2A promotes SPCH protein stability. (A–D) Confocal images of 3-dpg seedlings expressing (A) SPCH-CFP, (B) MUTE-GFP (C), GFP-FAMA, and (D) SCRM/ICE1-YFP grown with DMSO and 50 μM CT. (E and F) Confocal images of 3-dpg cotyledons of the (E) translational fusion SPCHpro::SPCH-CFP vs. (F) the transcriptional fusion SPCHpro::nucYFP seedlings in the WT background (Left) vs. in crispr-a1;a2;a3 (Right). (G) Confocal images of 3-dpg adaxial cotyledons of SPCH-CFP and SPCHpro::nucYFP (green) treated with DMSO or 50 μM CT for (Left to Right) 1, 4, and 24 h. Cell outlines are visualized by PI staining (magenta). (Scale bars in A–G, 50 μm.) (H and I) Quantification of CFP- or YFP-positive cells in 3-dpg (H) SPCHpro::SPCH-CFP, n = 884 to 2,865 cells and (I) SPCHpro::nucYFP, n = 650 to 1,482 cells. Data are mean ± SD. Student’s t test, **P < 0.001, n.s., not significant.

