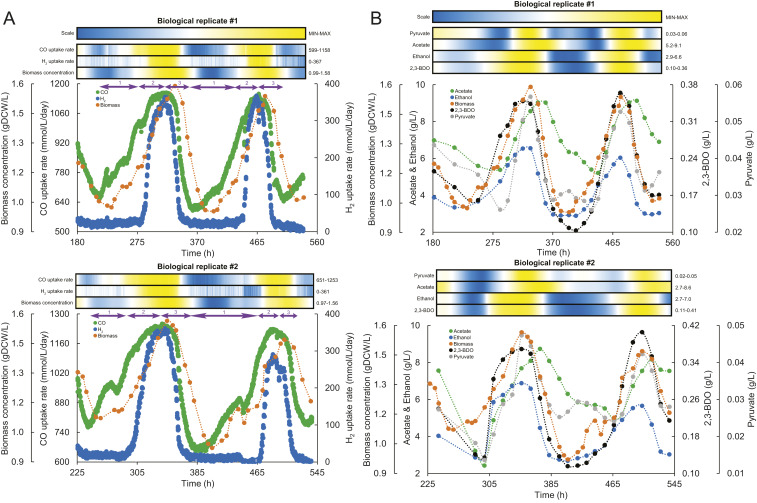
Fig. 1.
Oscillatory behavior of Clostridium autoethanogenum continuous cultures. (A) Oscillations in gas uptake rates and biomass concentration for two biological replicate cultures (#1 and #2). Numbers 1, 2, and 3 in purple font together with arrows above the graphs denote three phases (1, growth on CO; 2, growth on CO and H2; 3, crash). (B) Oscillations in extracellular metabolite levels and biomass concentration for two biological replicate cultures (#1 and #2). Heat maps show the relative change of the respective parameter between its minimum and maximum value (denoted on the right of heat map) with color scale shown on the top. Heat maps were generated with values derived from using spline (third-order polynomial cubic spline with point count 1) on the measured values to achieve higher resolution. time, fermentation duration from culture inoculation. 2,3-BDO, 2,3-butanediol.

